CFSv2 Forecast Grid Initialization – North America: 2026/07/18
CFSv2 Forecast Grid Initialization – Global: 2026/07/18
| 7-day Forecast Means - Global | |||||||||||
|---|---|---|---|---|---|---|---|---|---|---|---|
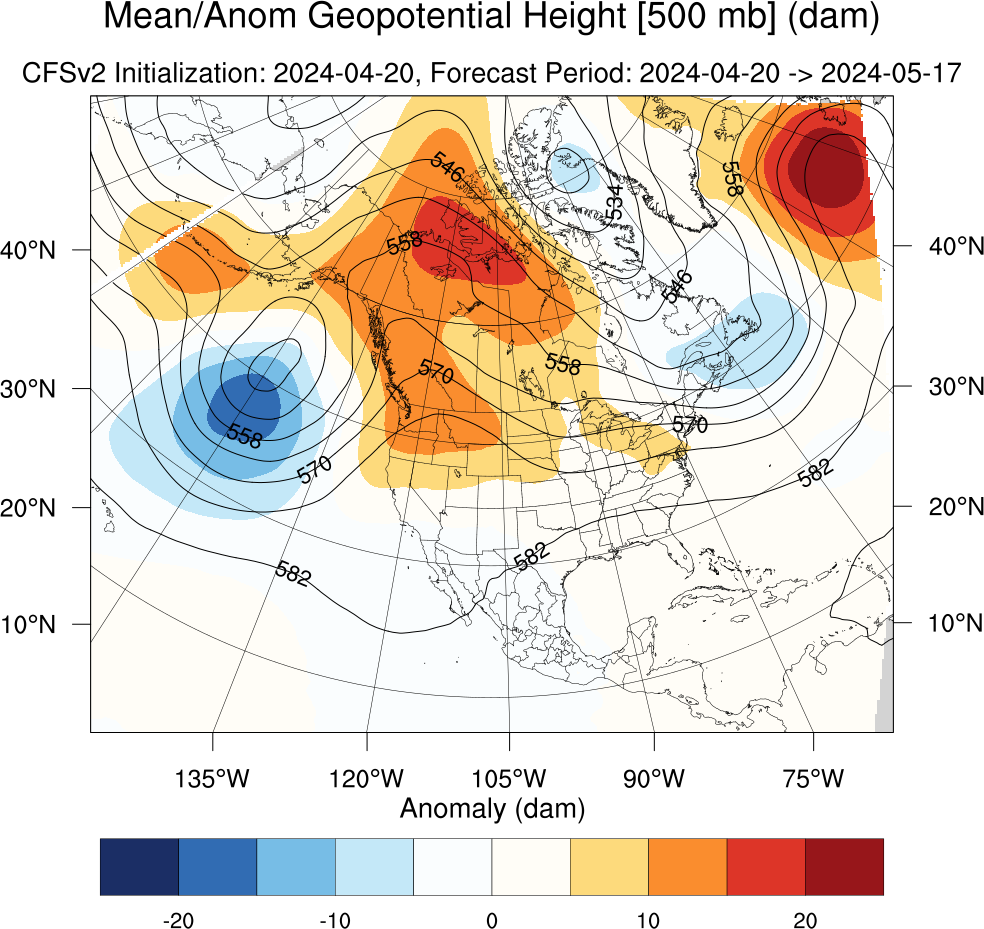
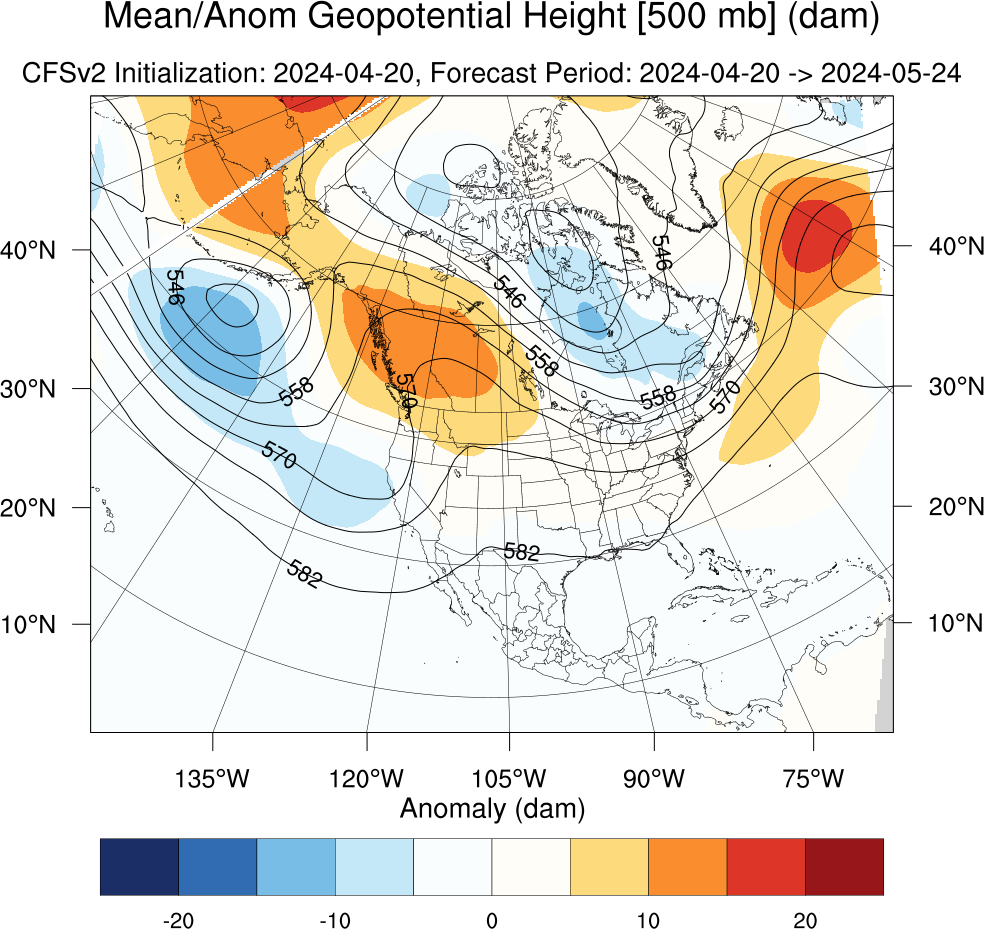
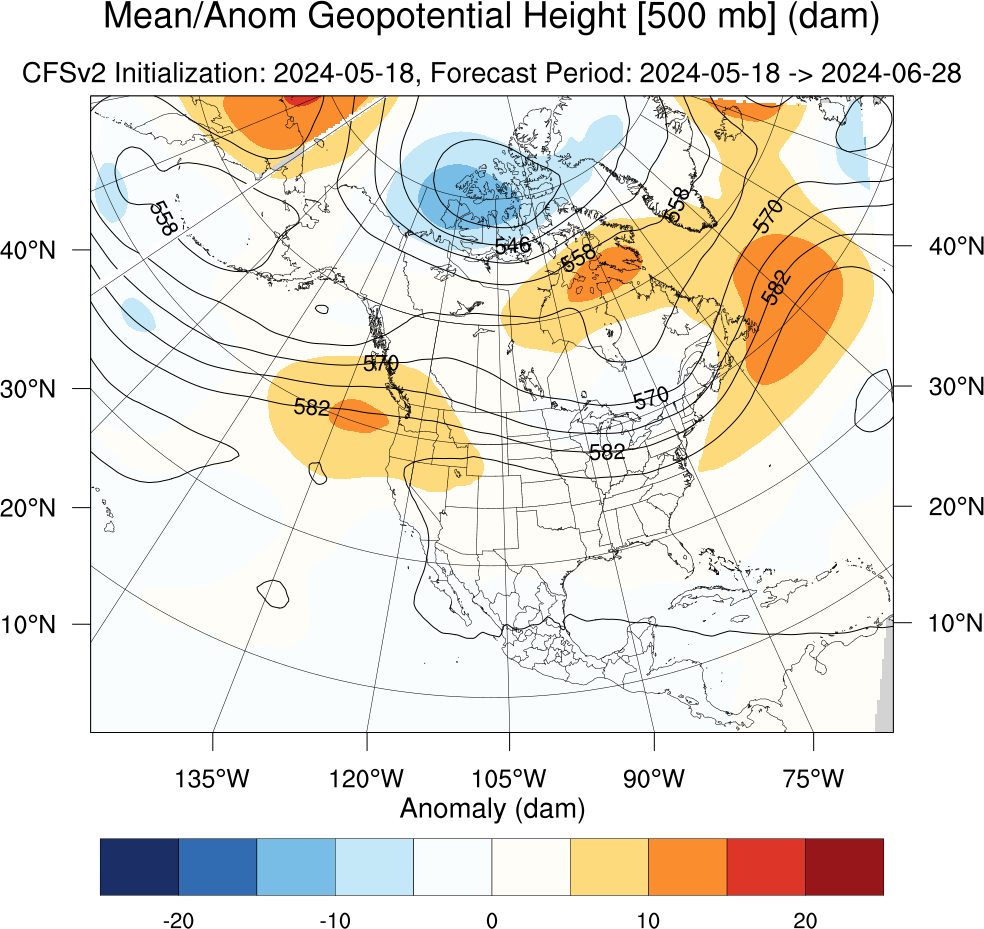
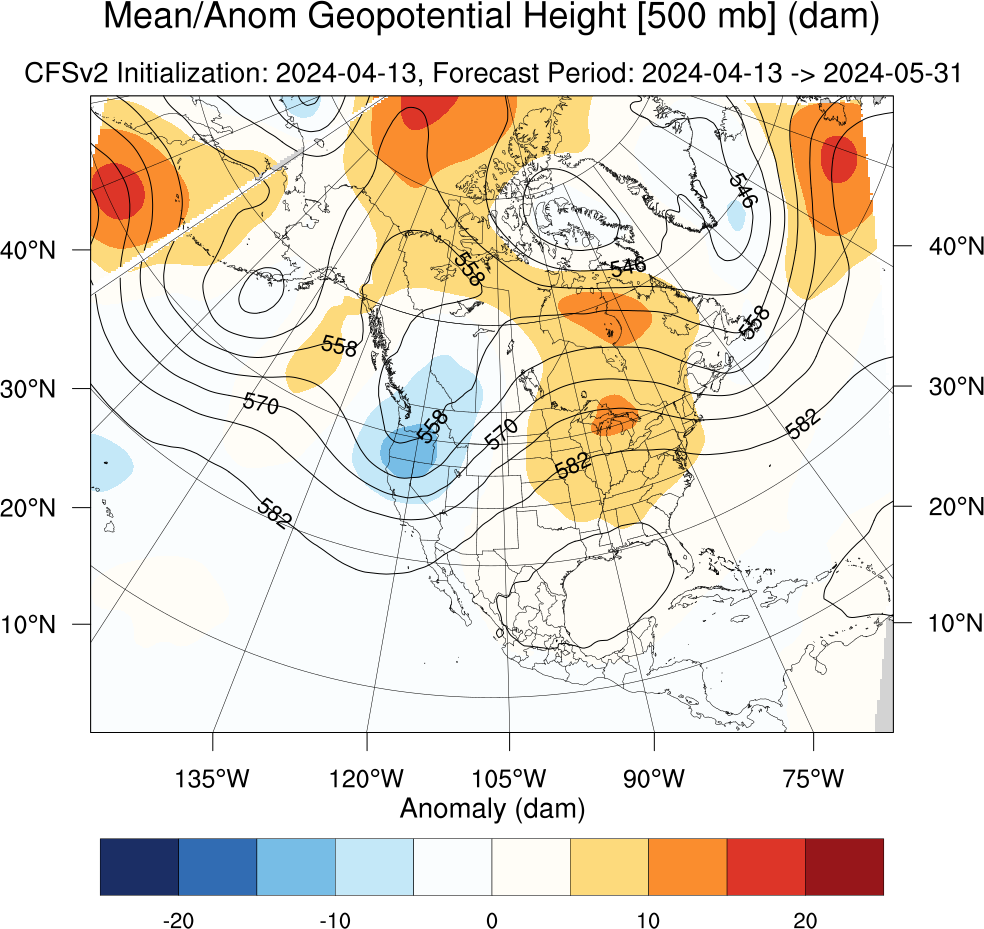
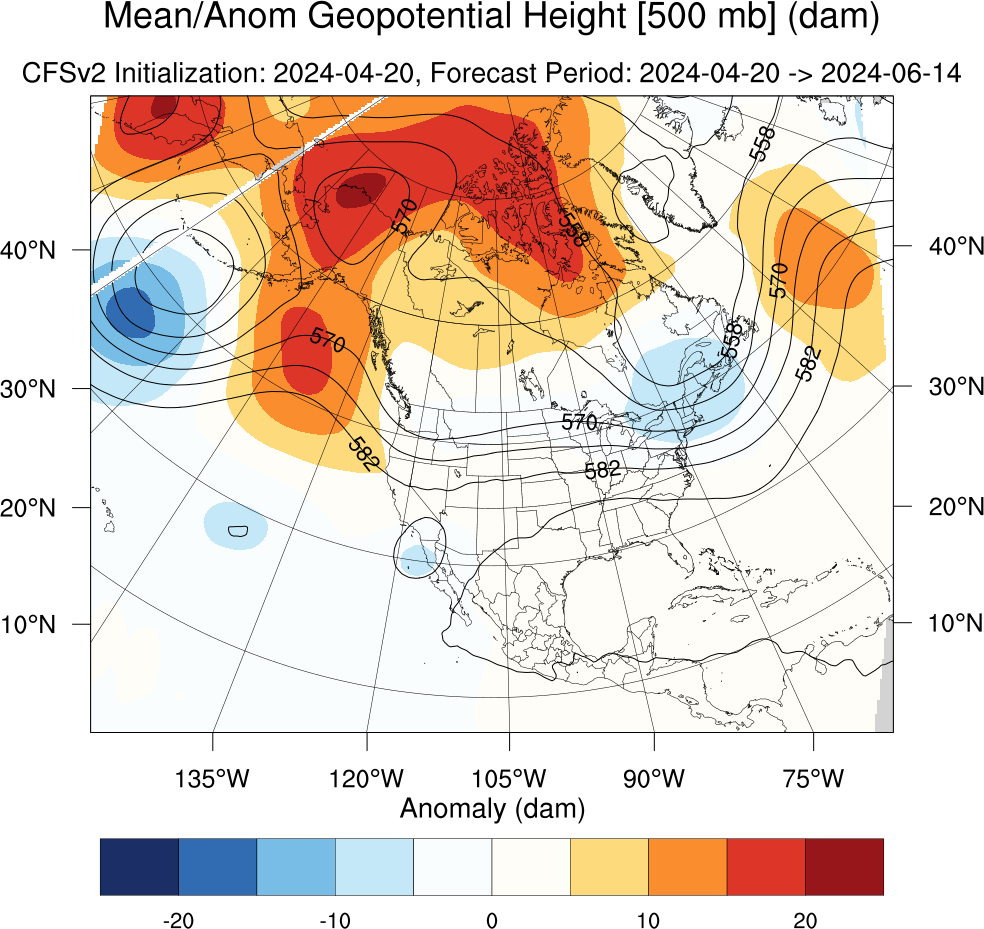
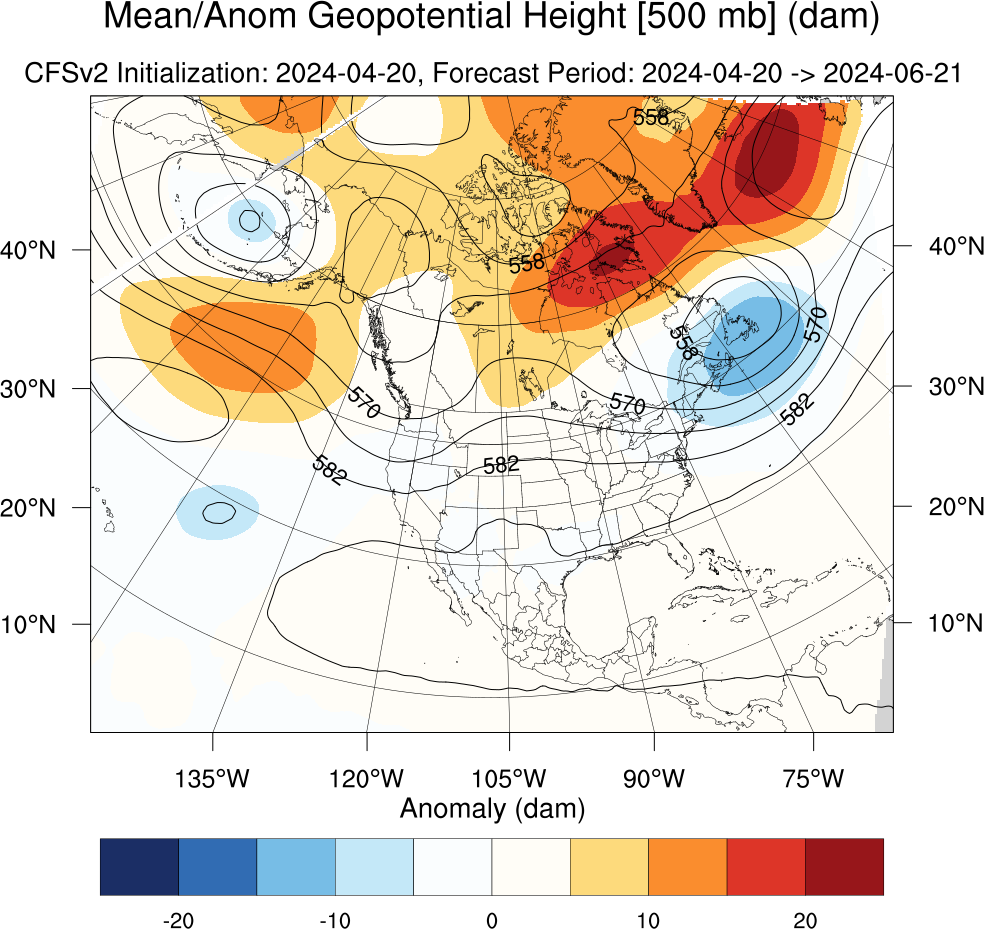
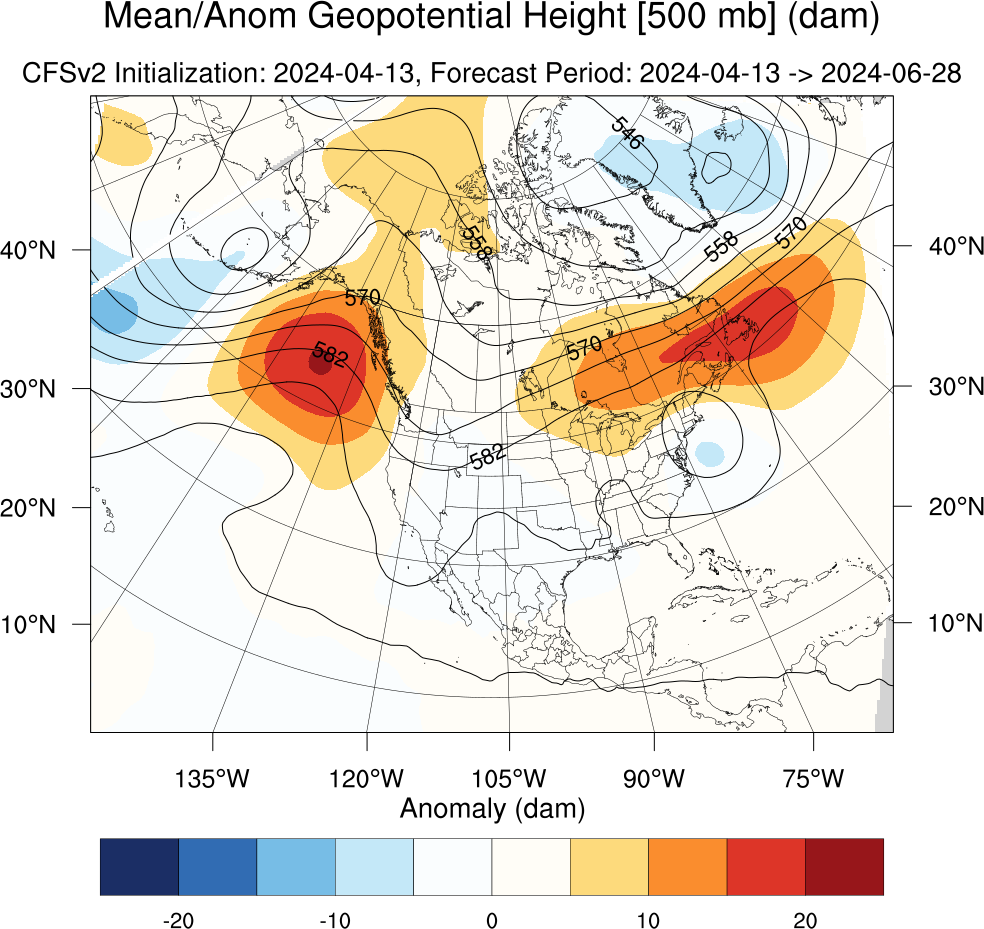
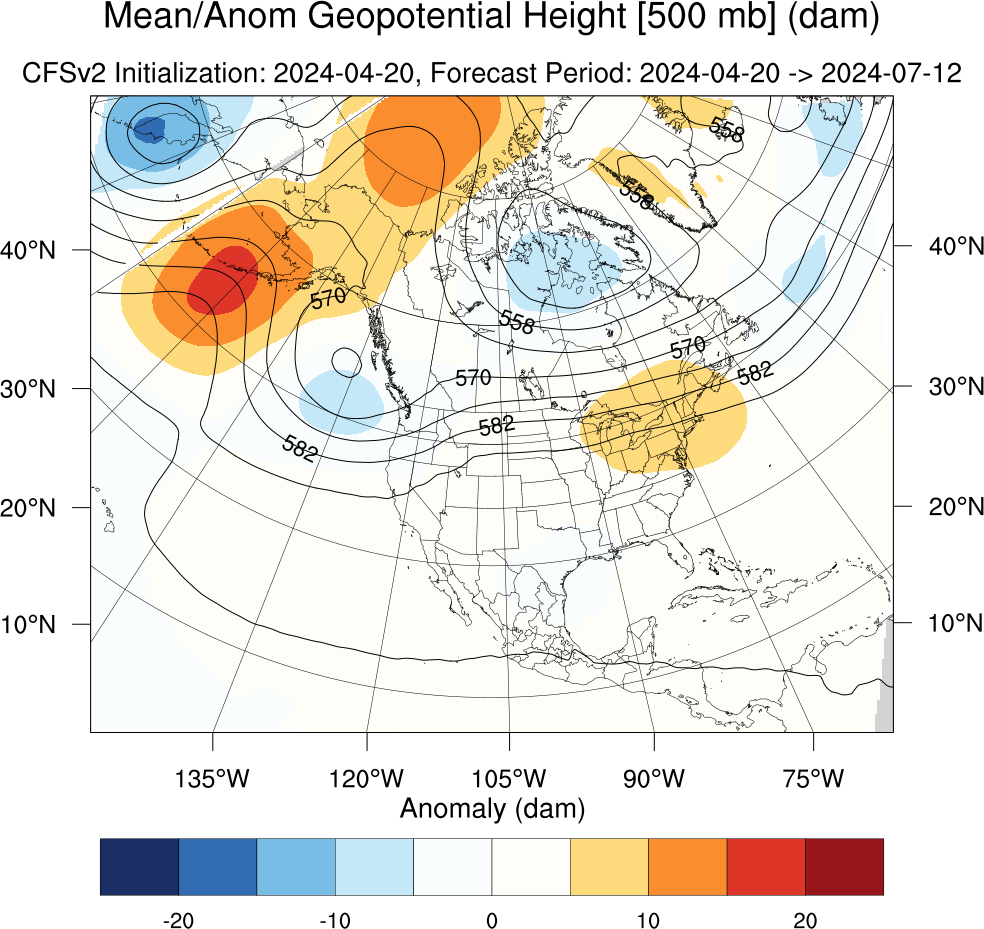
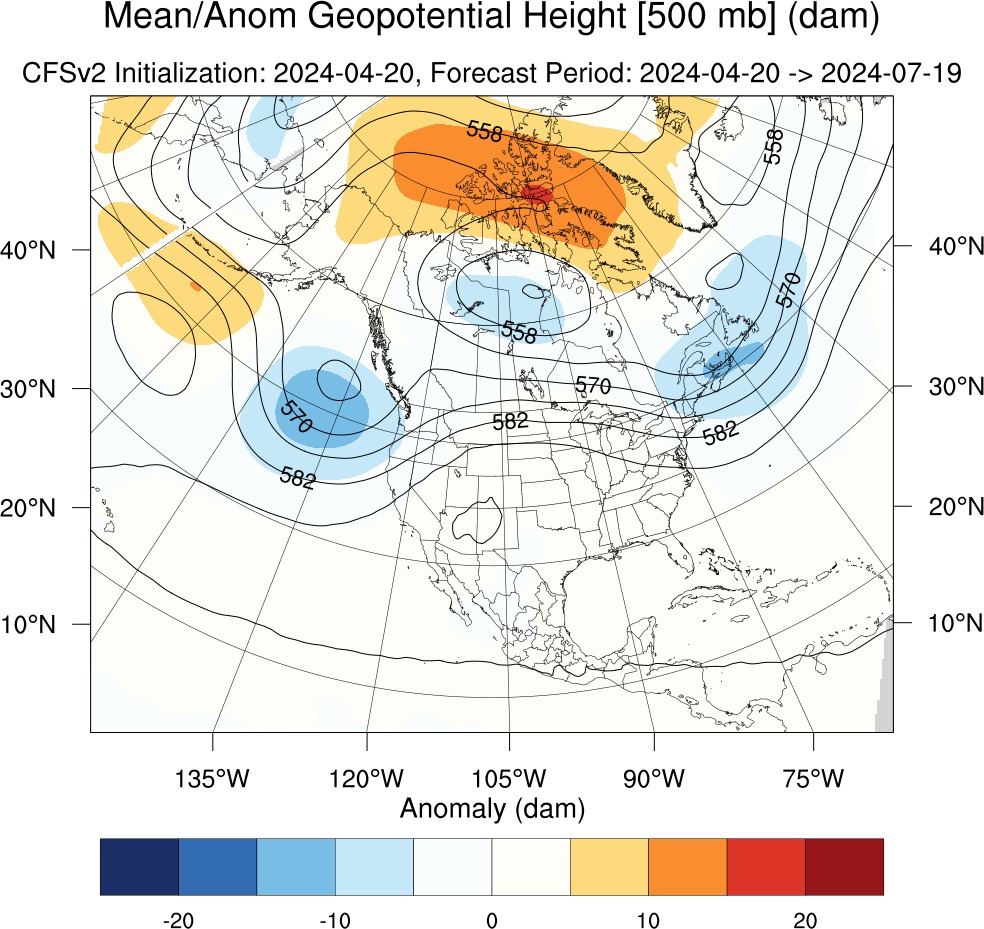
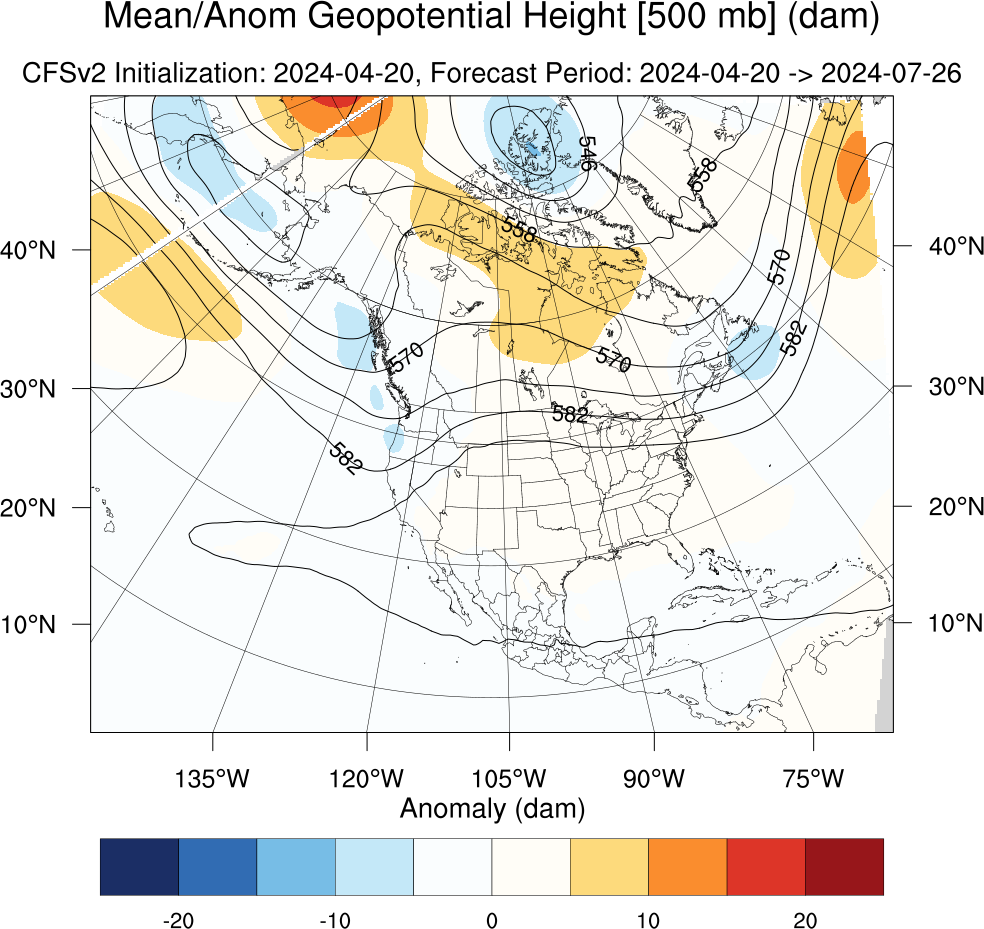
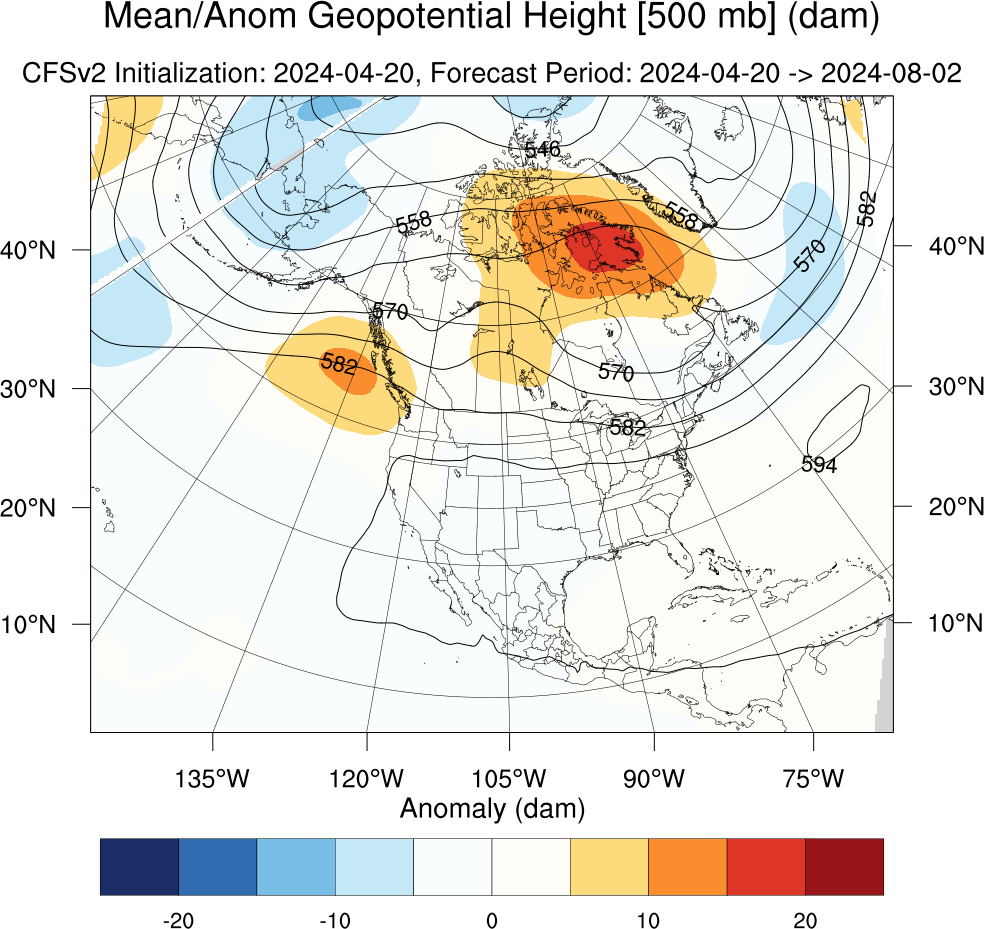
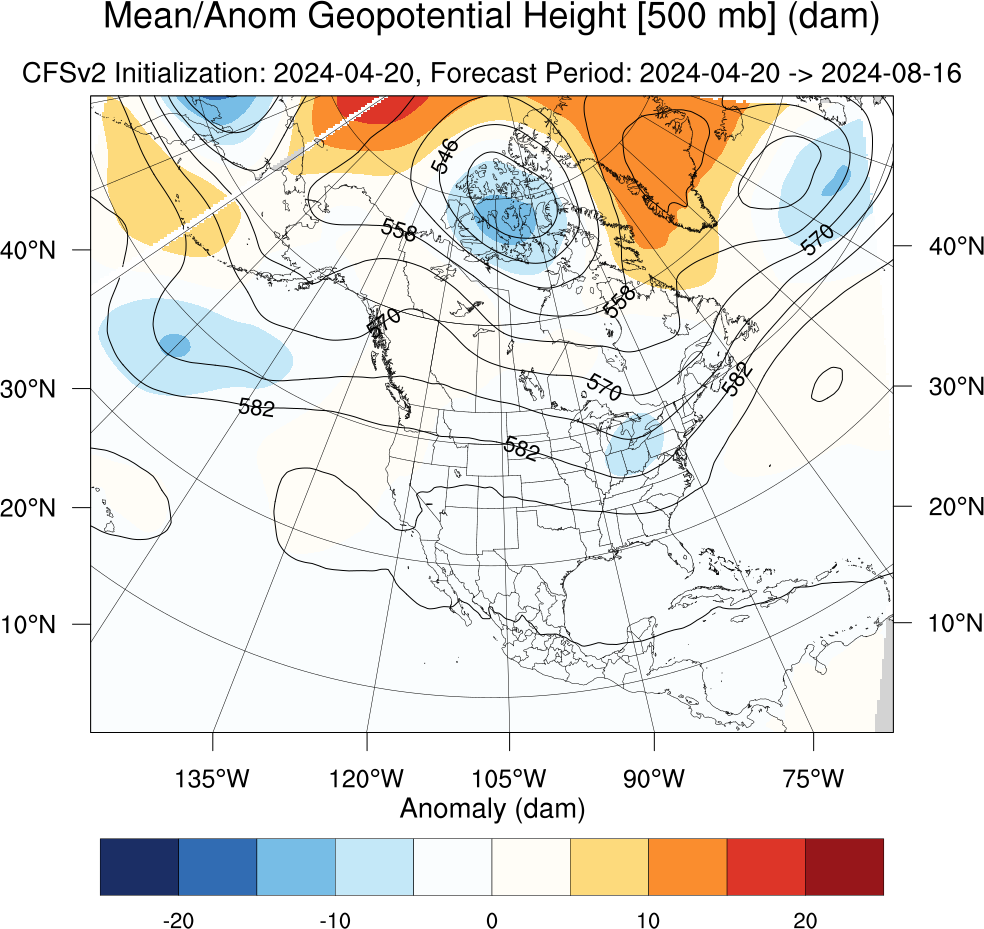
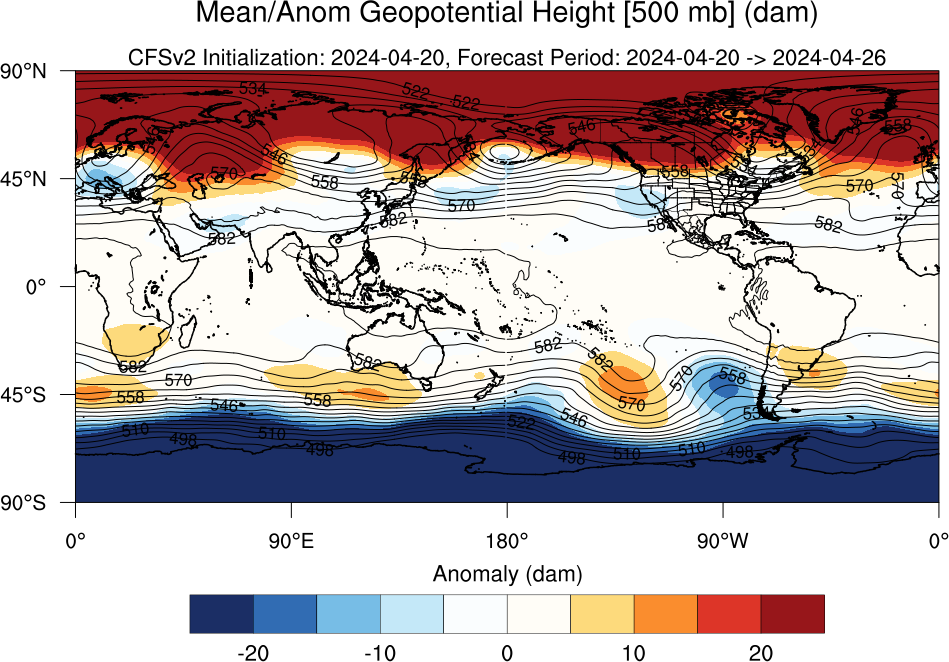
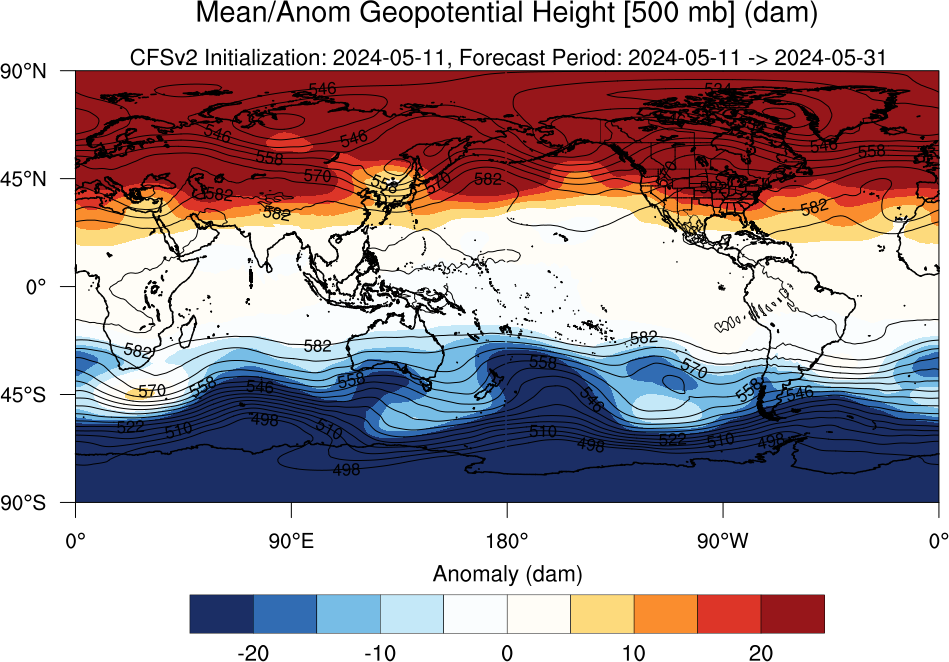
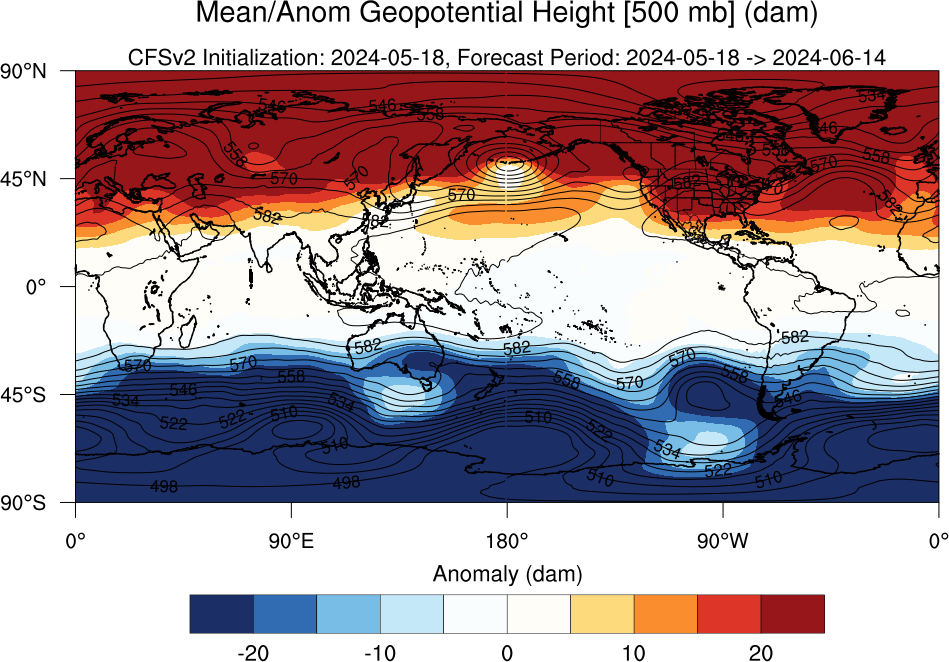
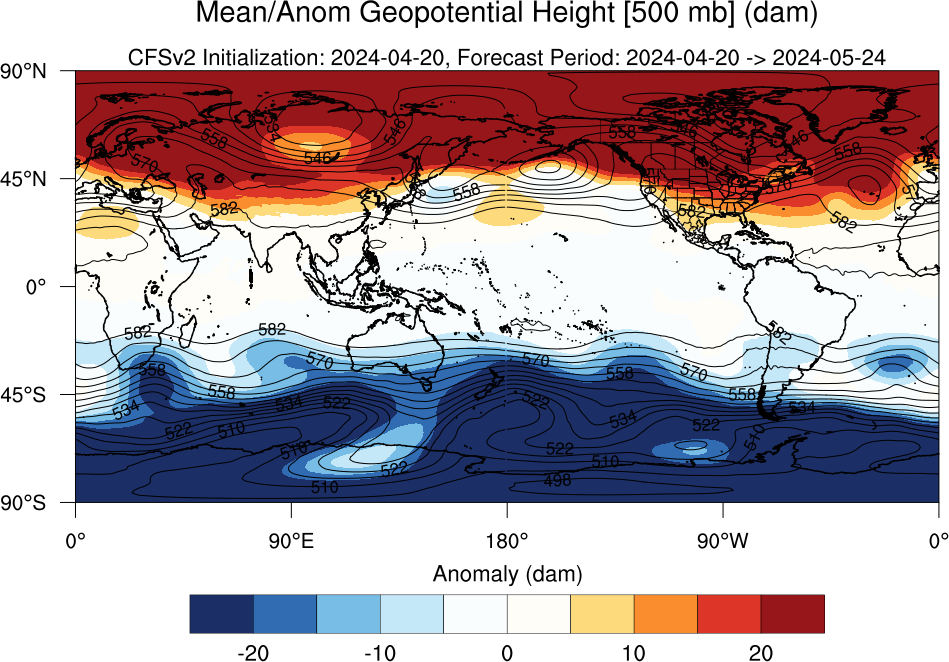
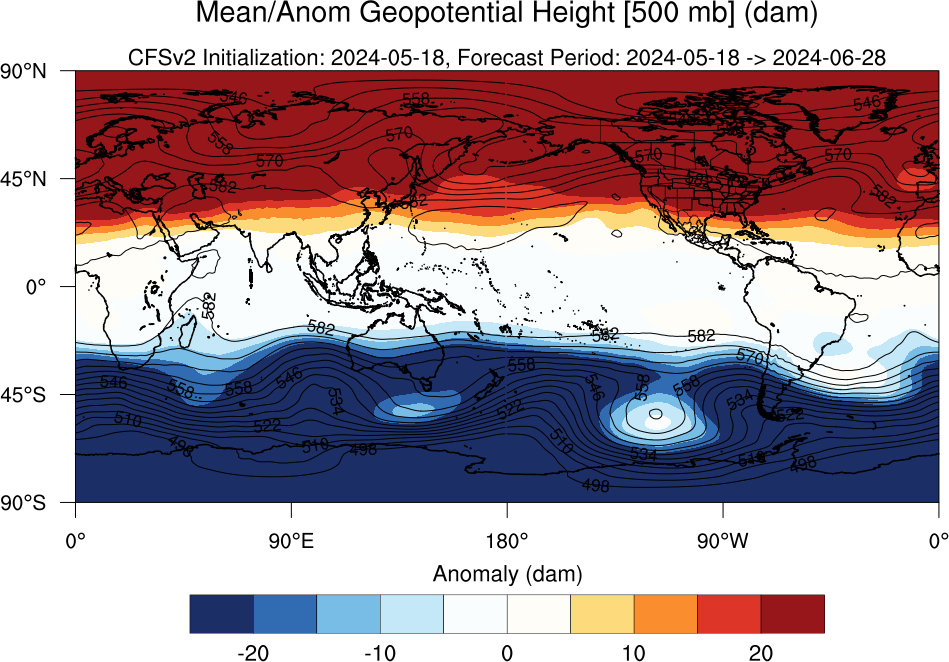
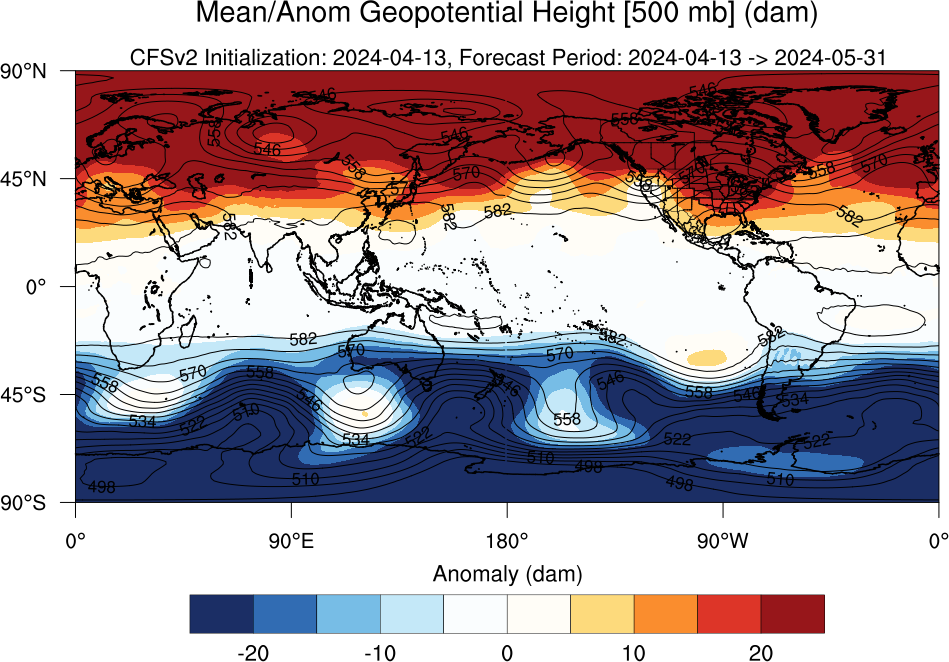
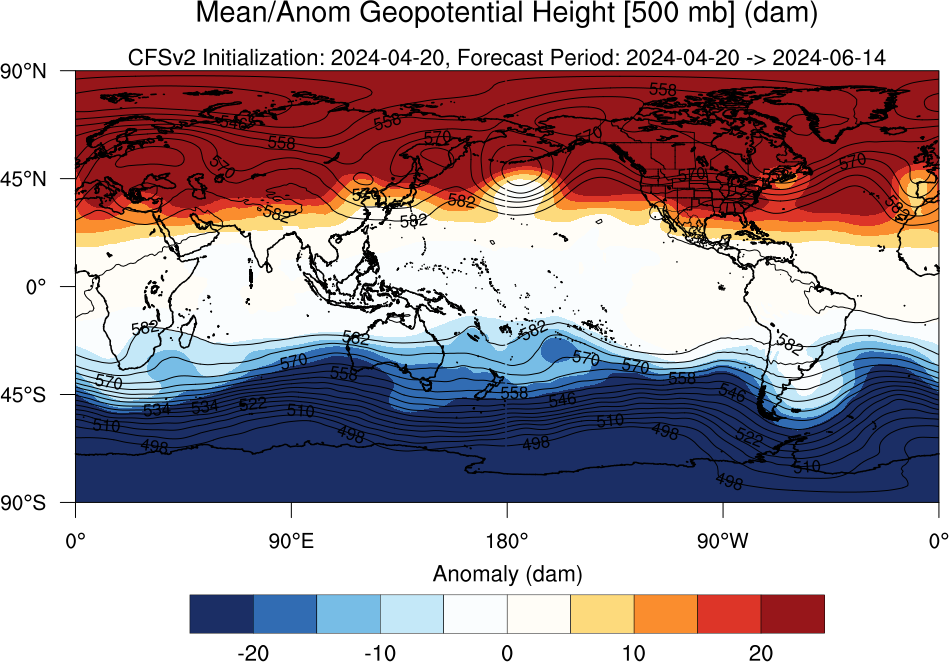
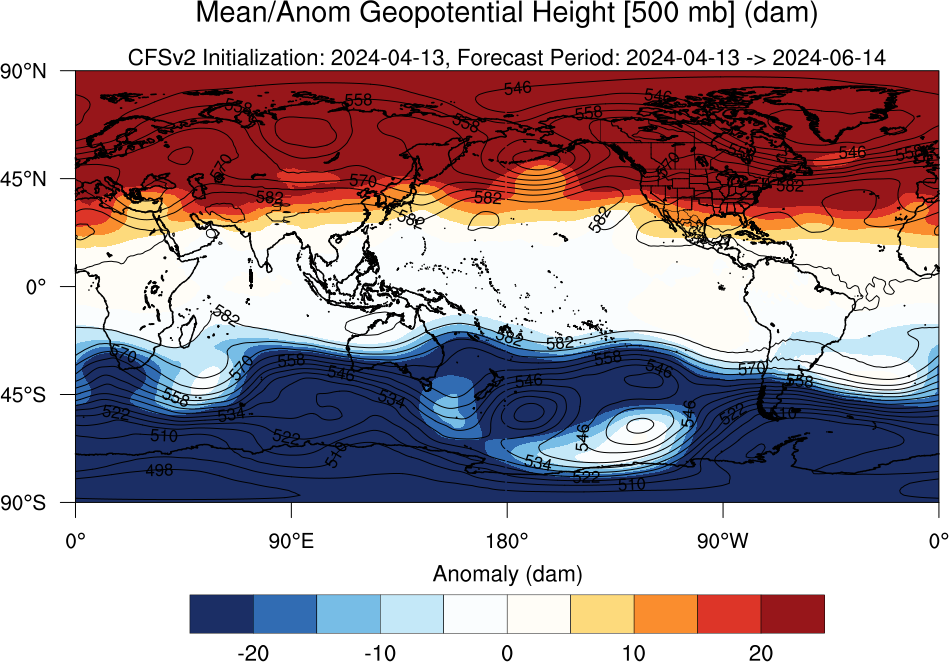
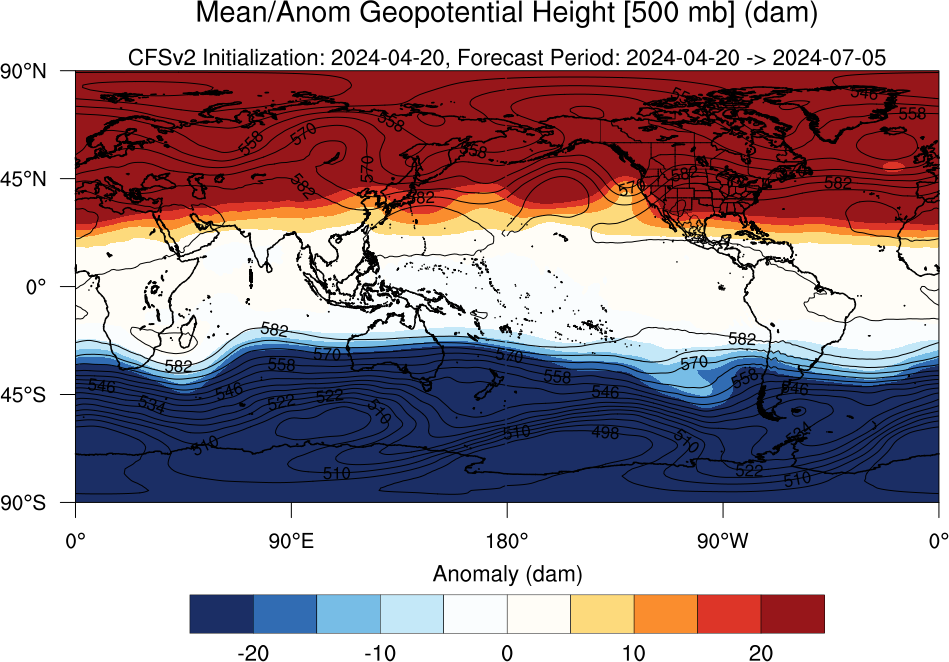
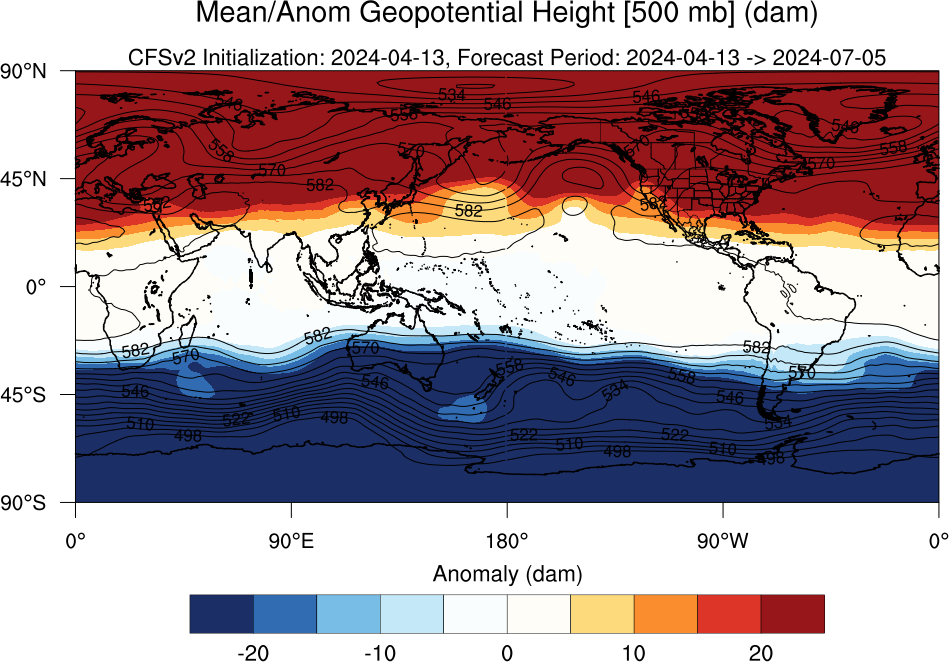
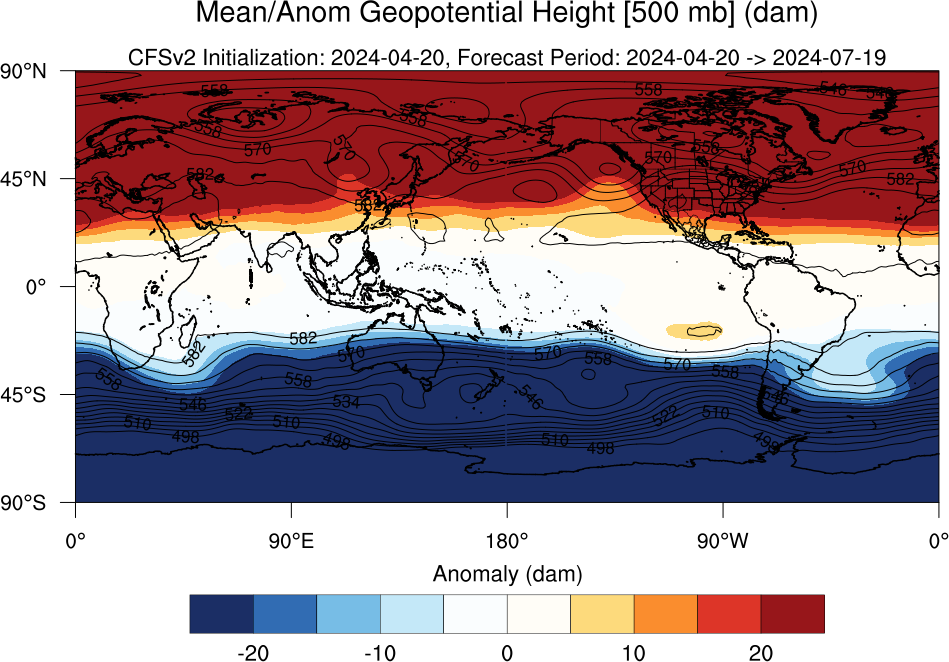
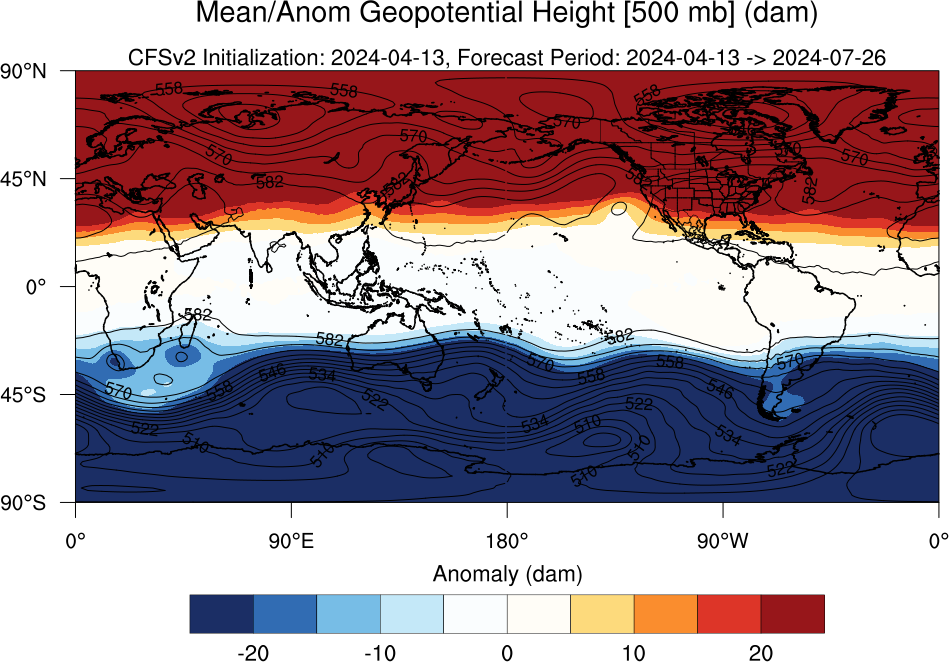
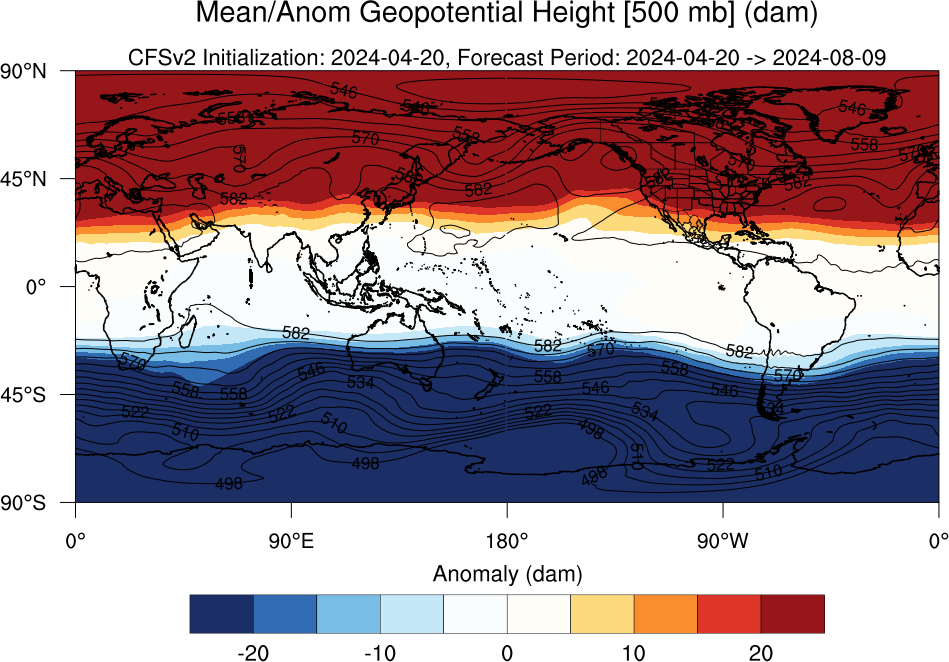
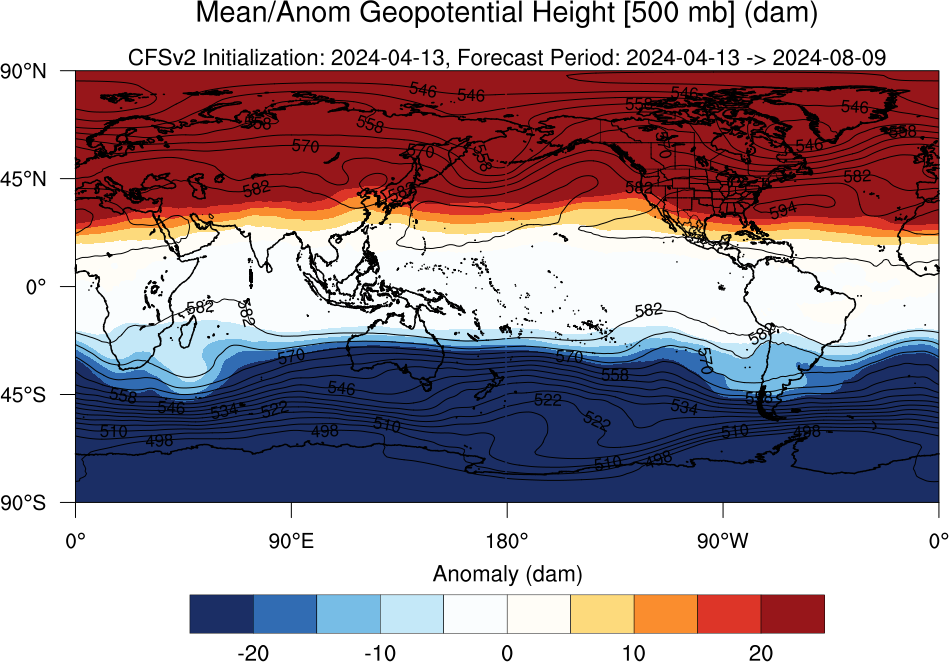
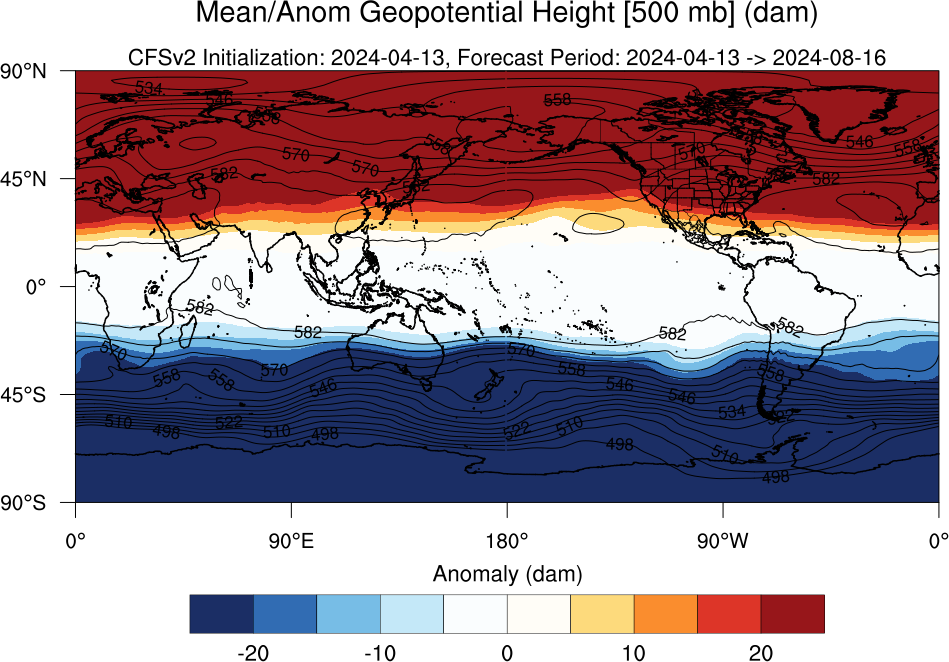
| Mean/Anom Geopotential Height [500 mb] (dam) | Loop | Grid | 18Jul | 25Jul | 01Aug | 08Aug | 15Aug | 22Aug | 29Aug | 05Sep | 12Sep |
| 19Sep | 26Sep | 03Oct | 10Oct | 17Oct | 24Oct | 31Oct | 07Nov | 14Nov | |||
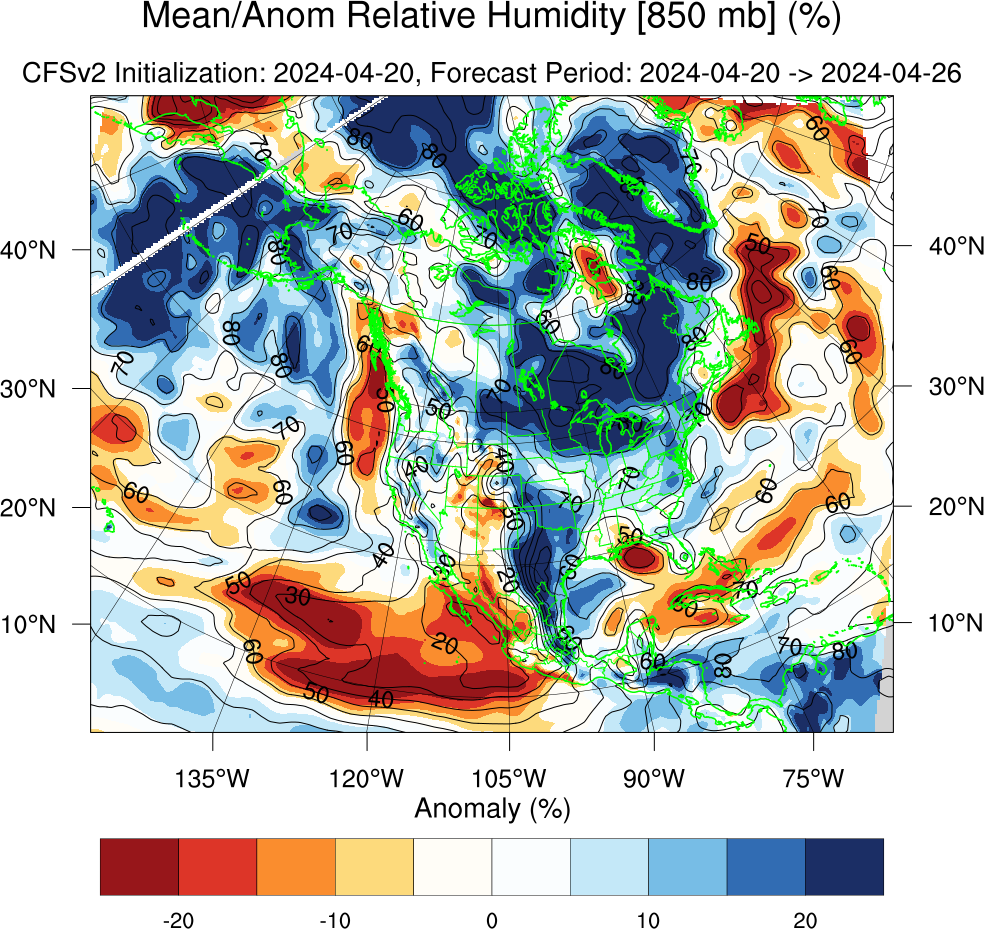
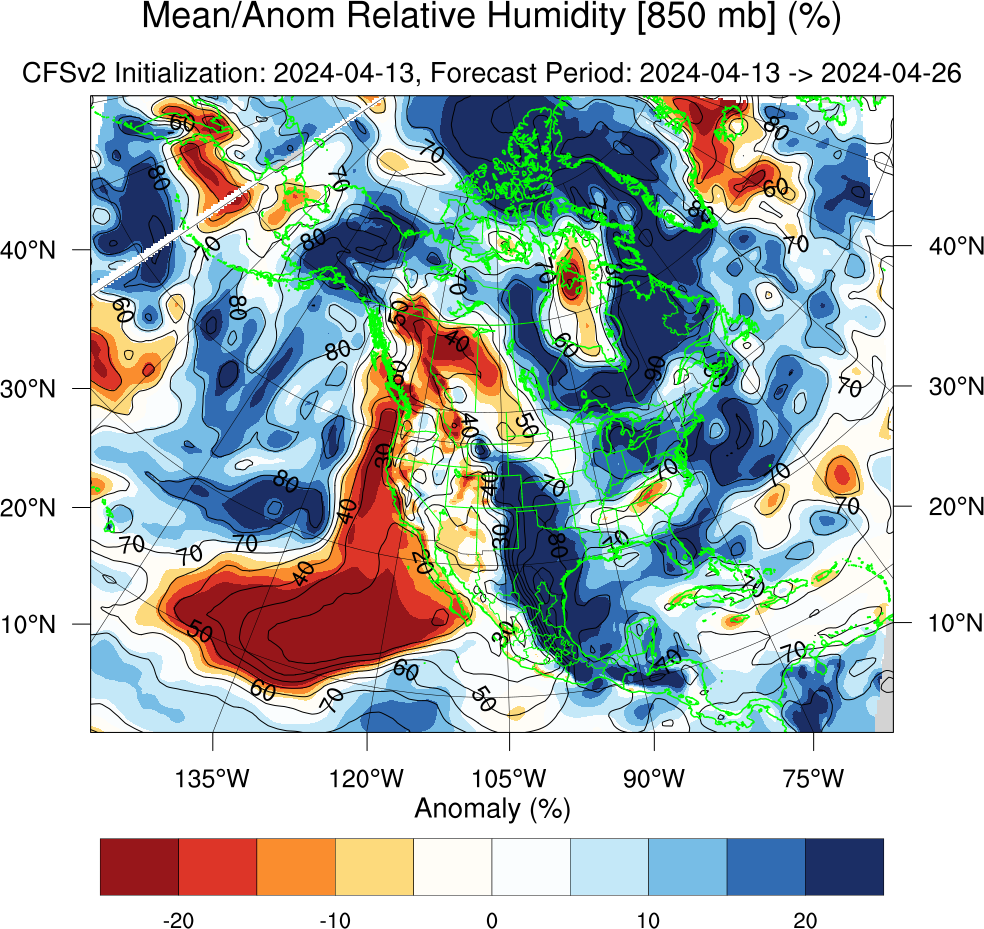
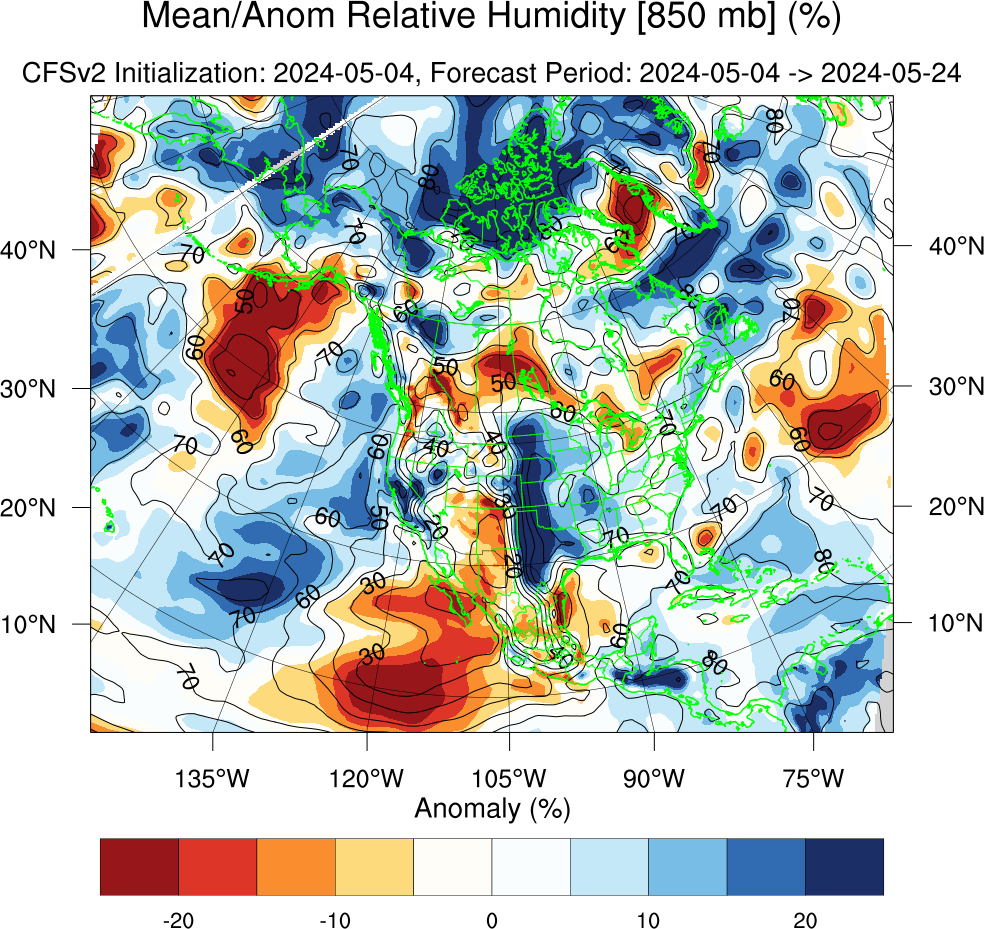
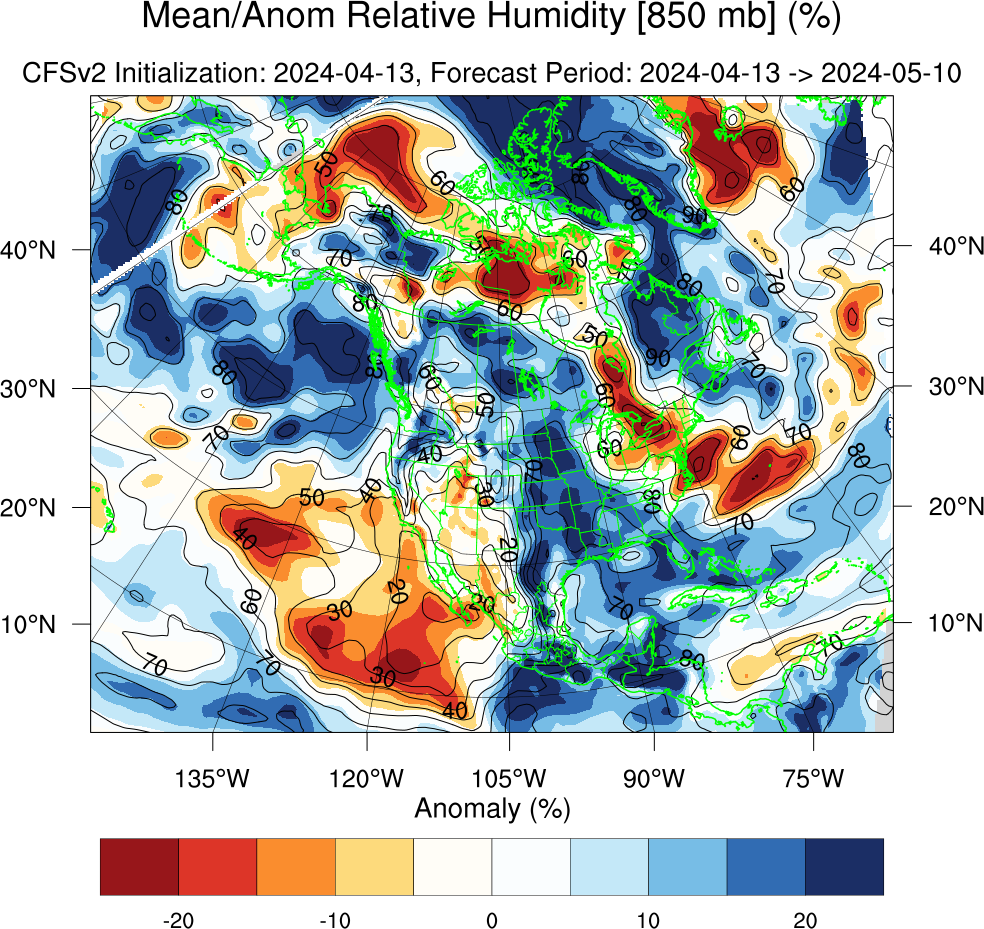
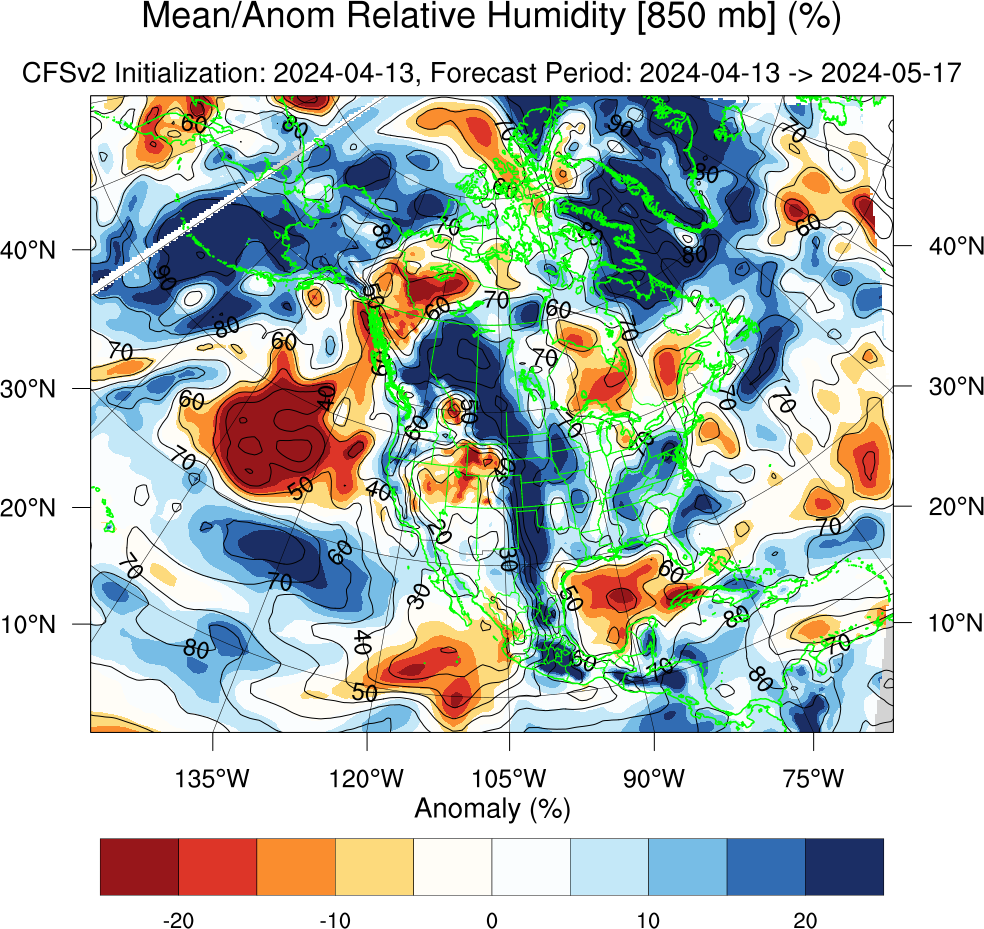
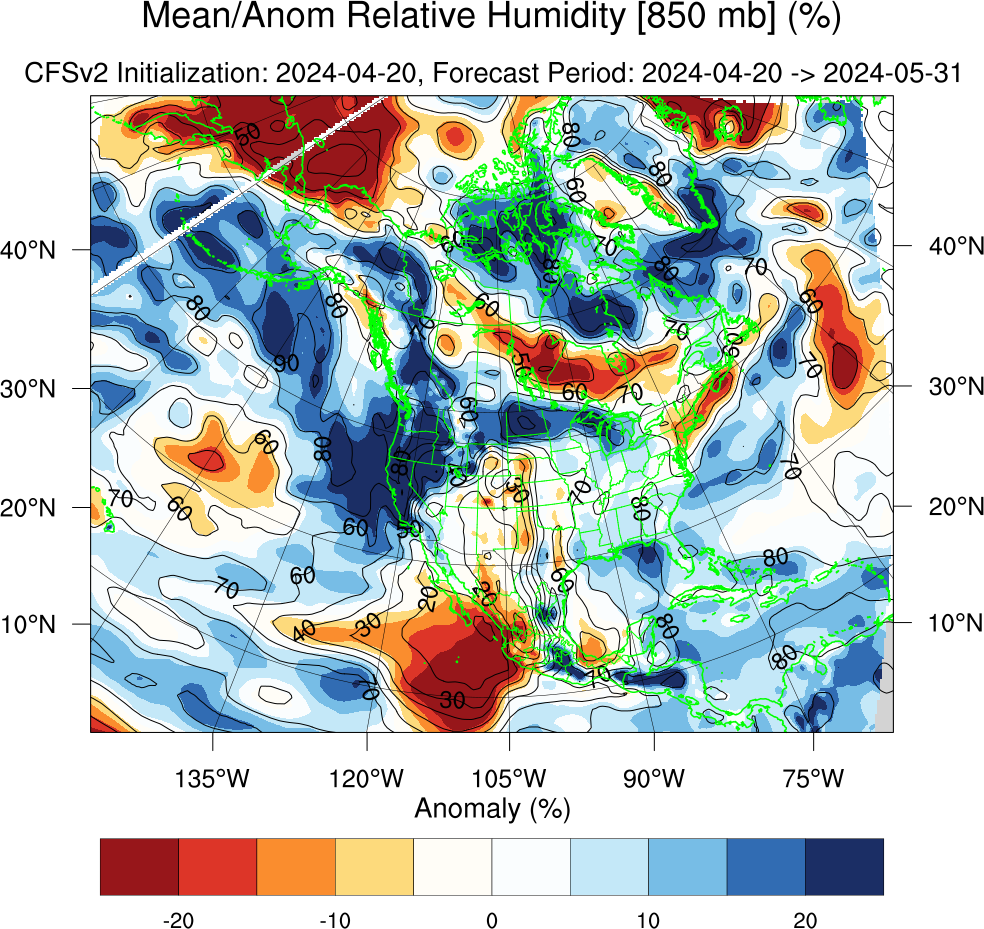
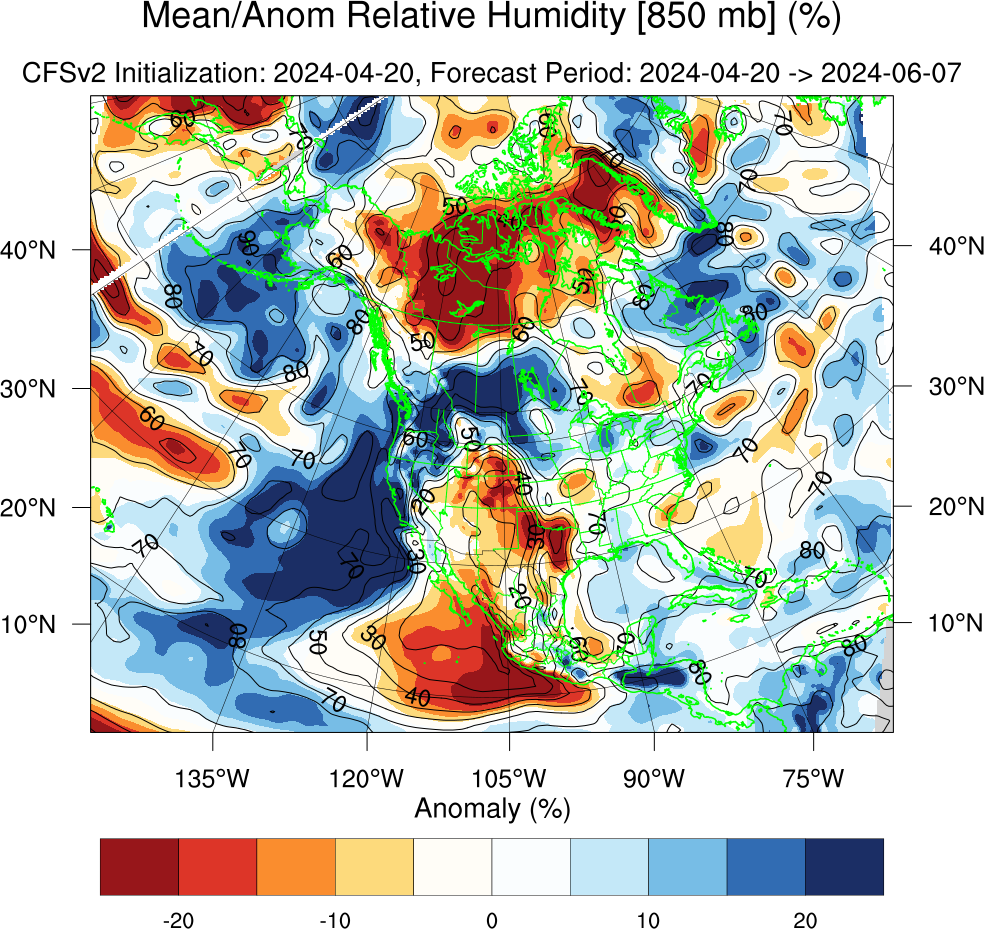
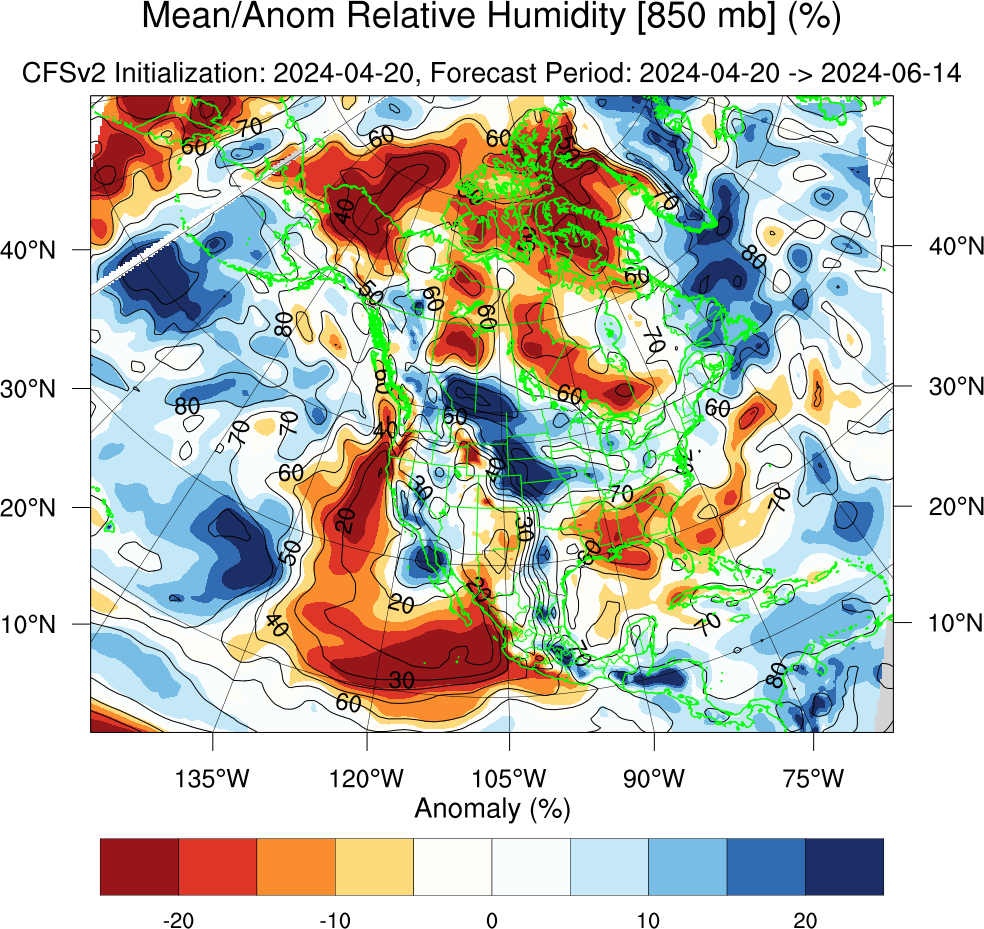
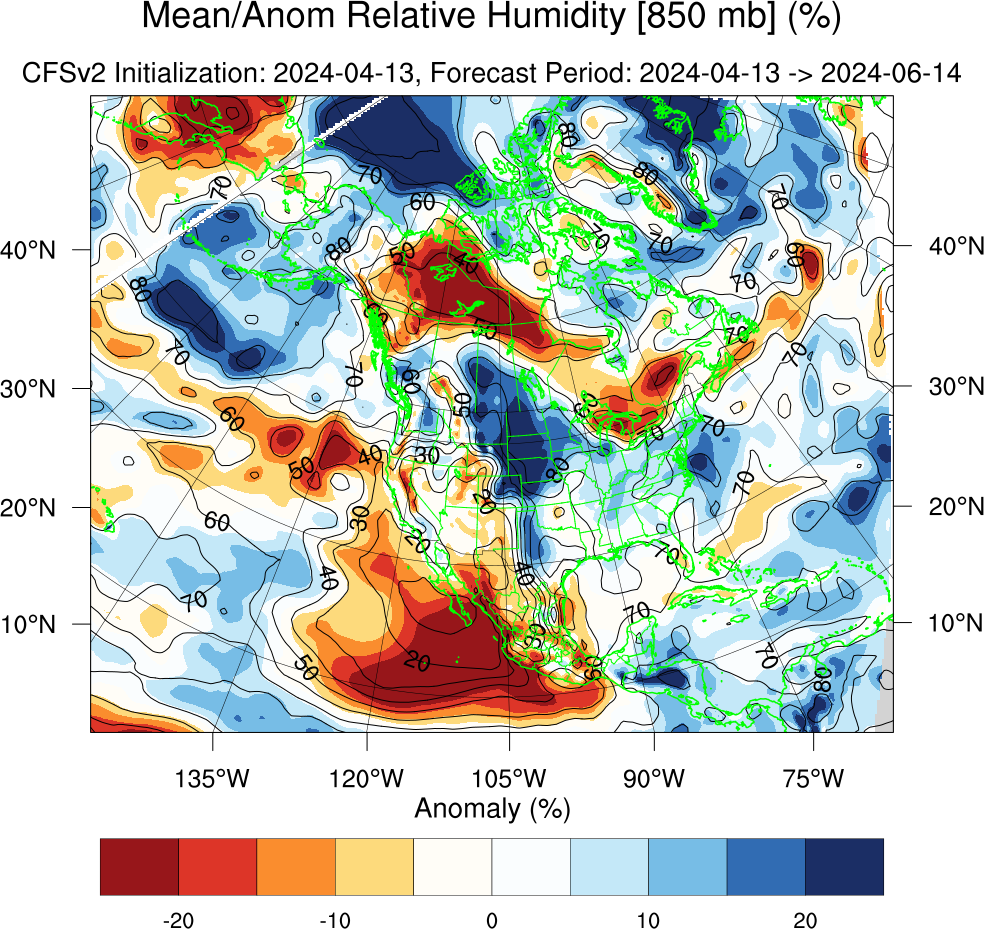
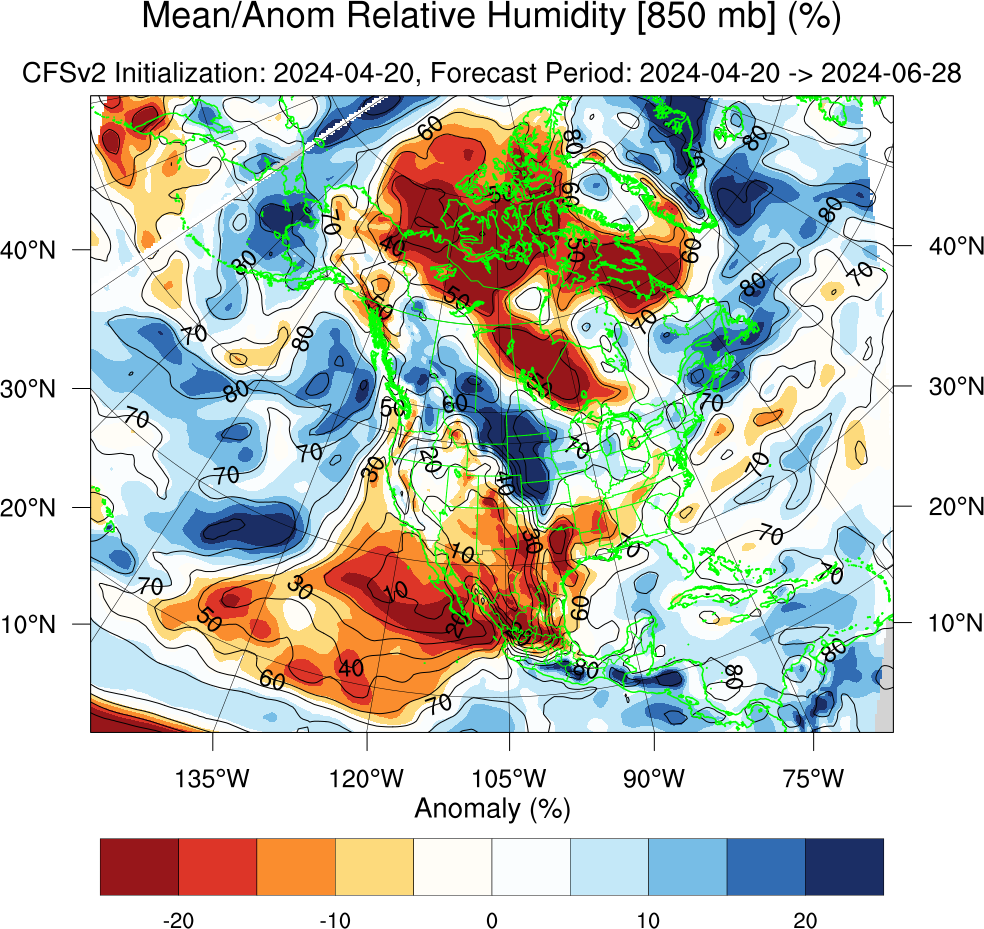
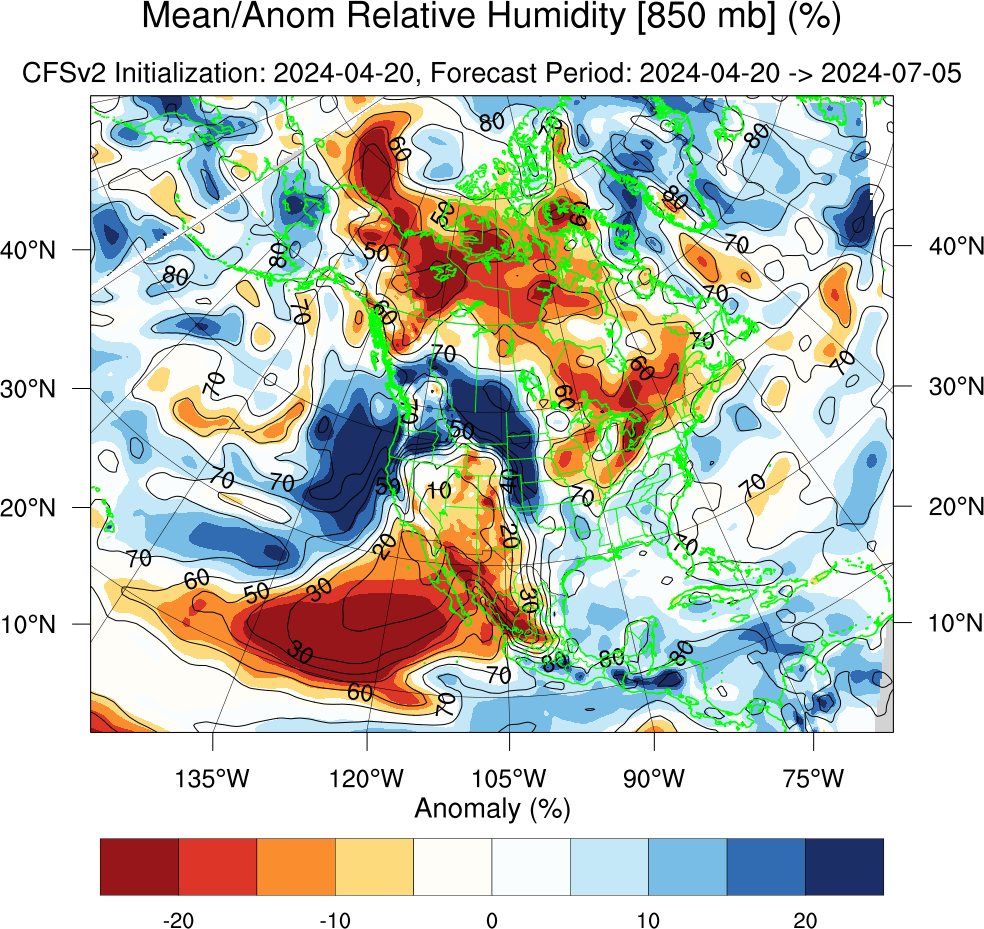
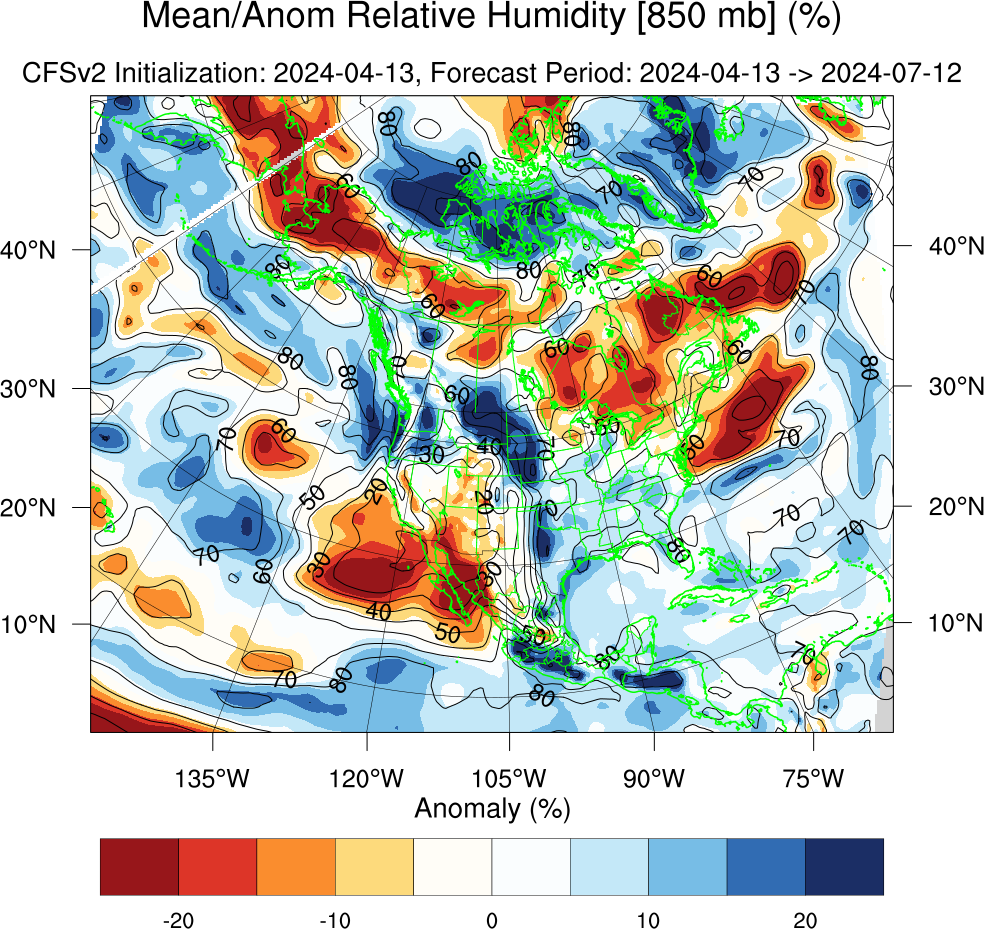
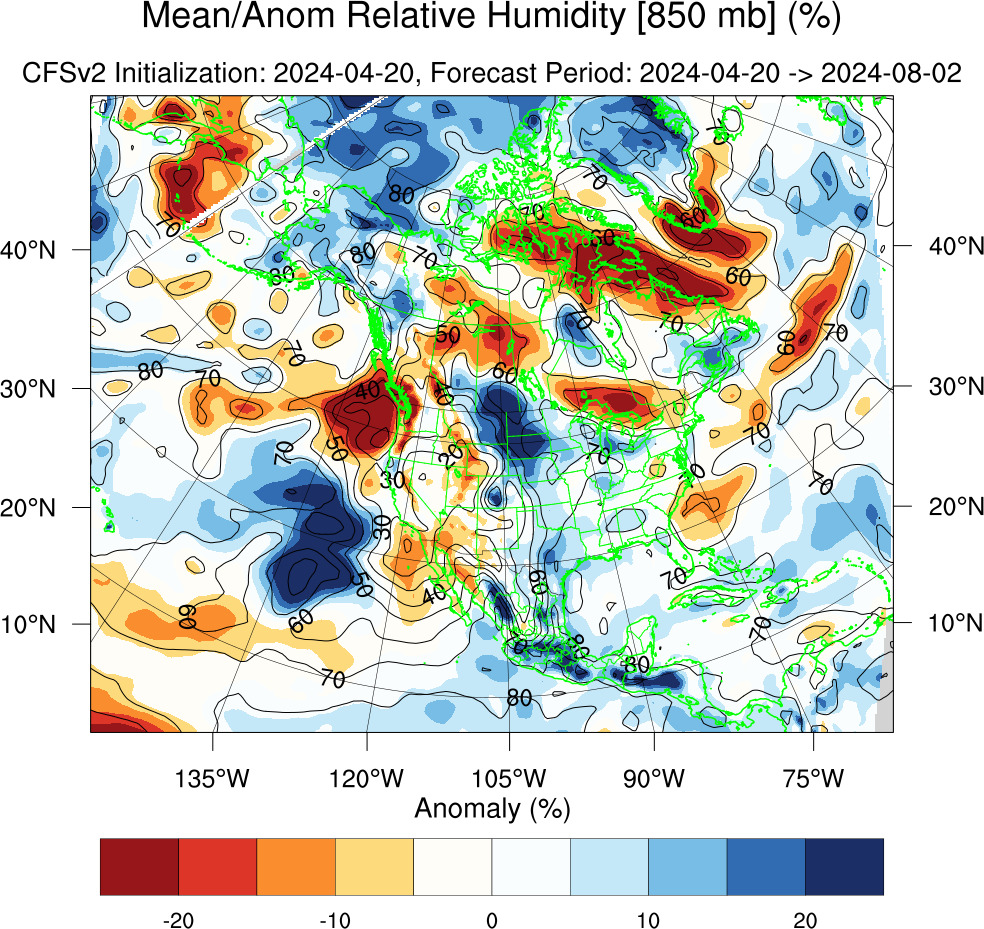
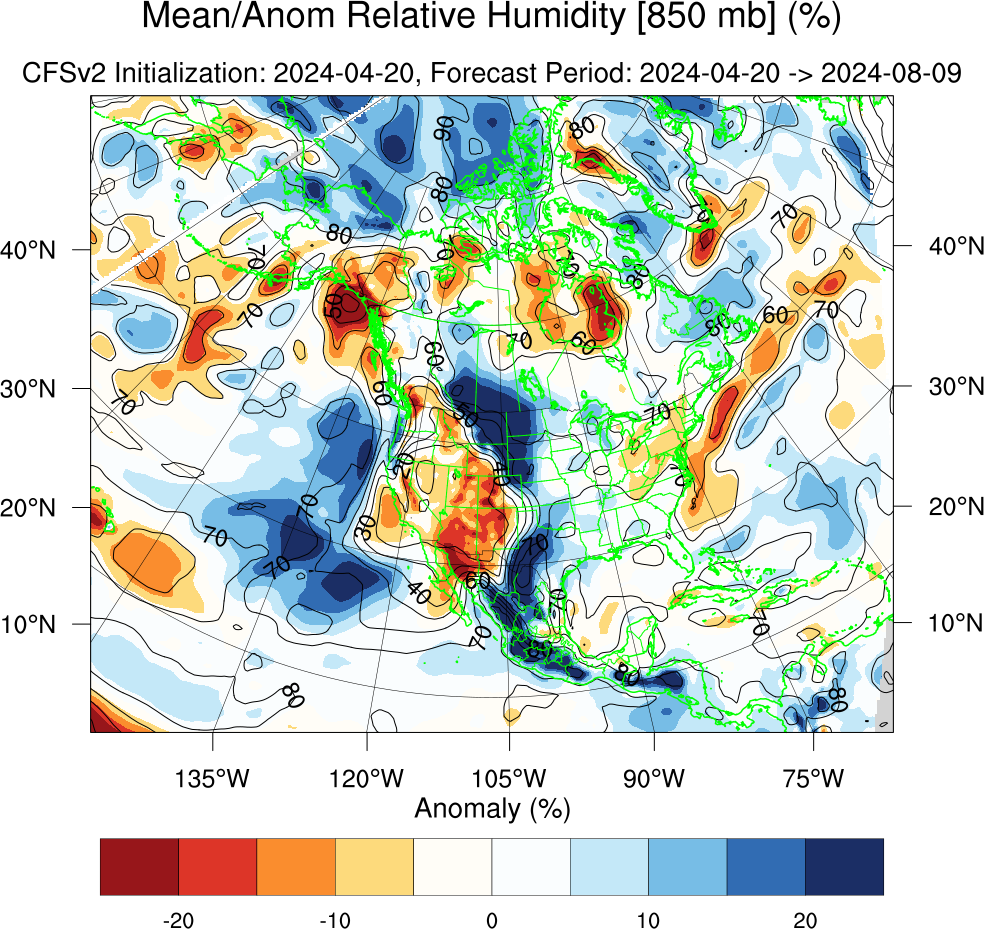
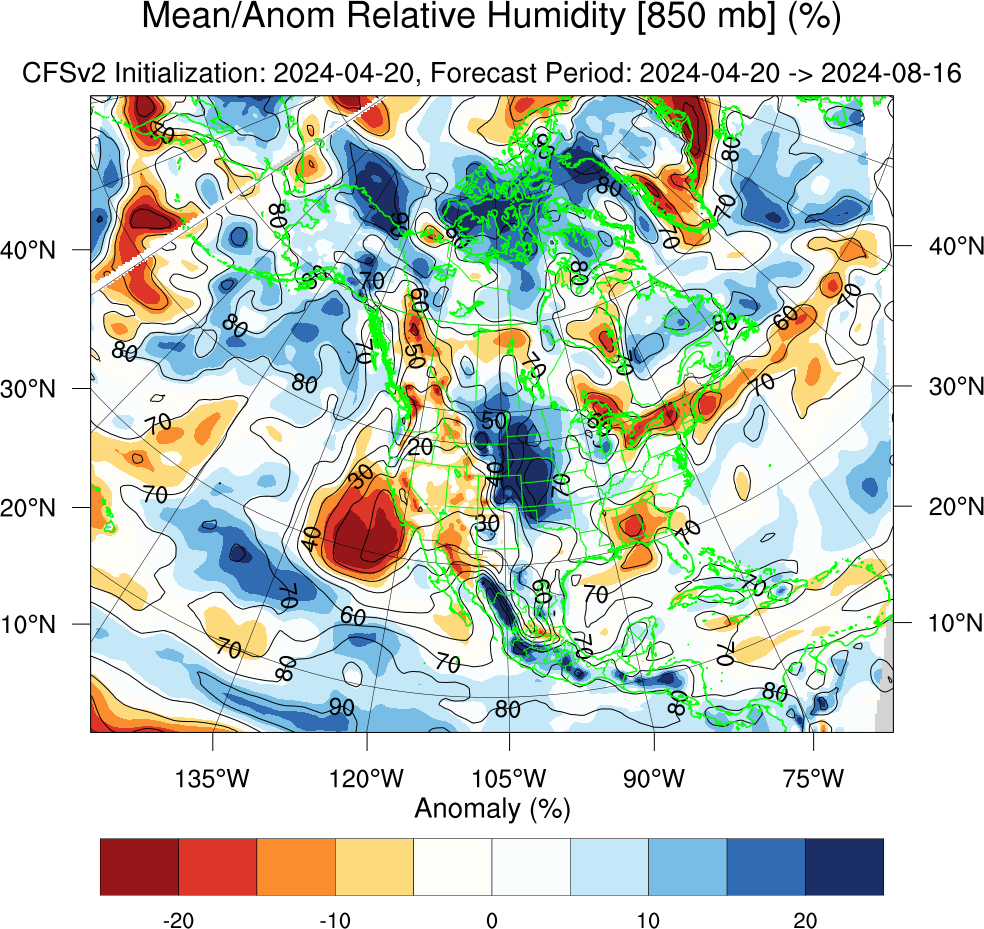
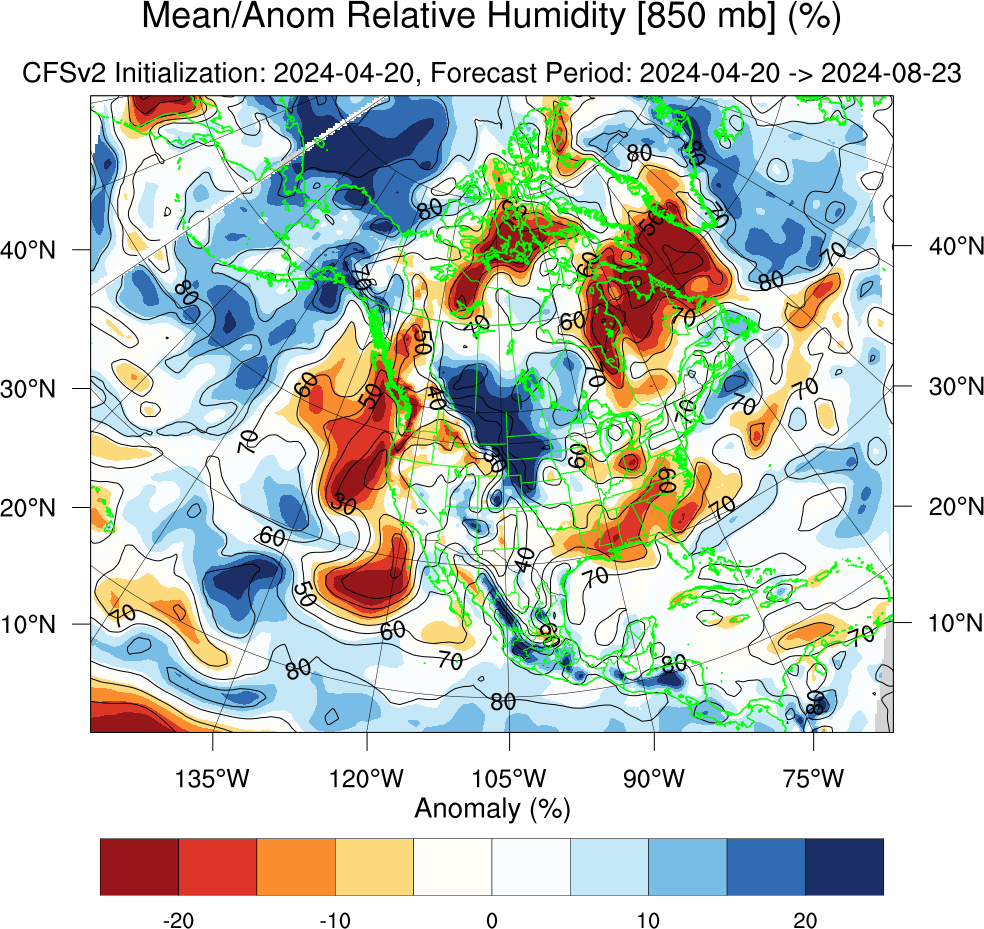
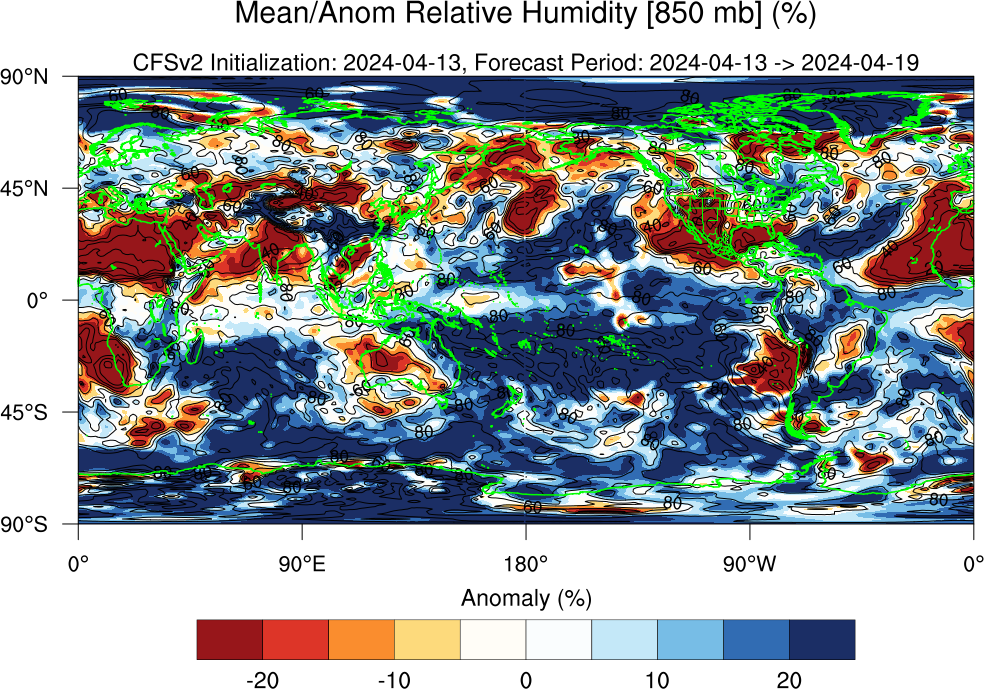
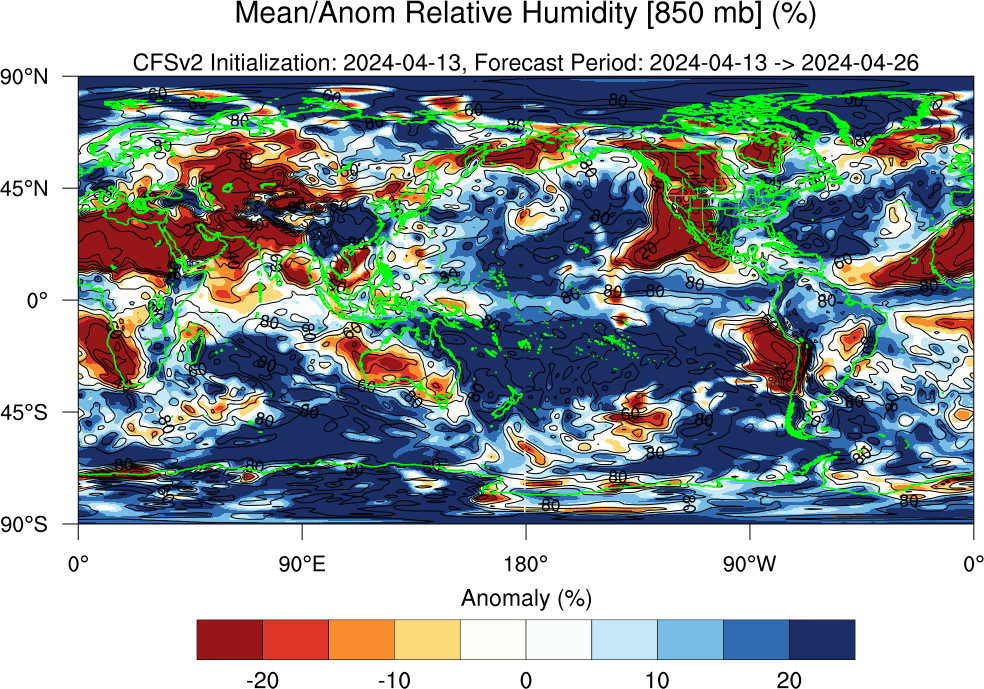
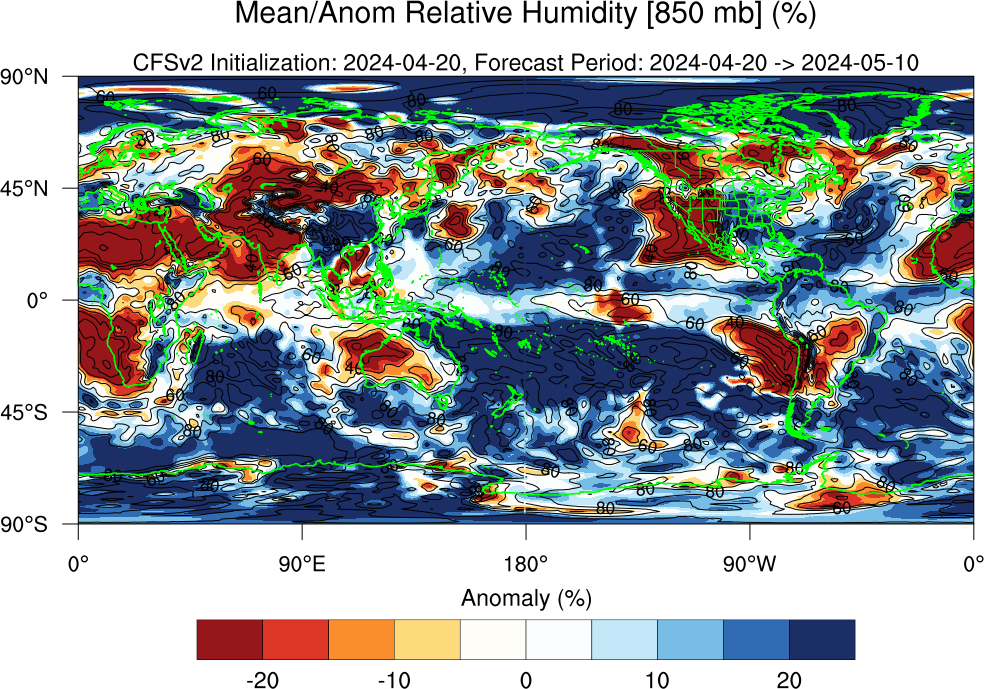
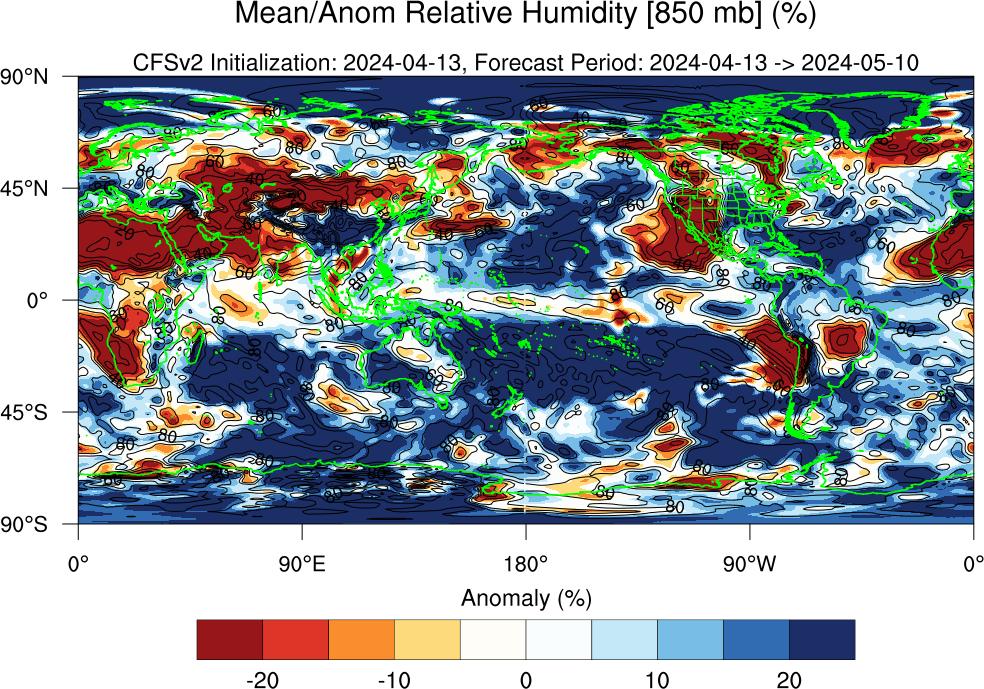
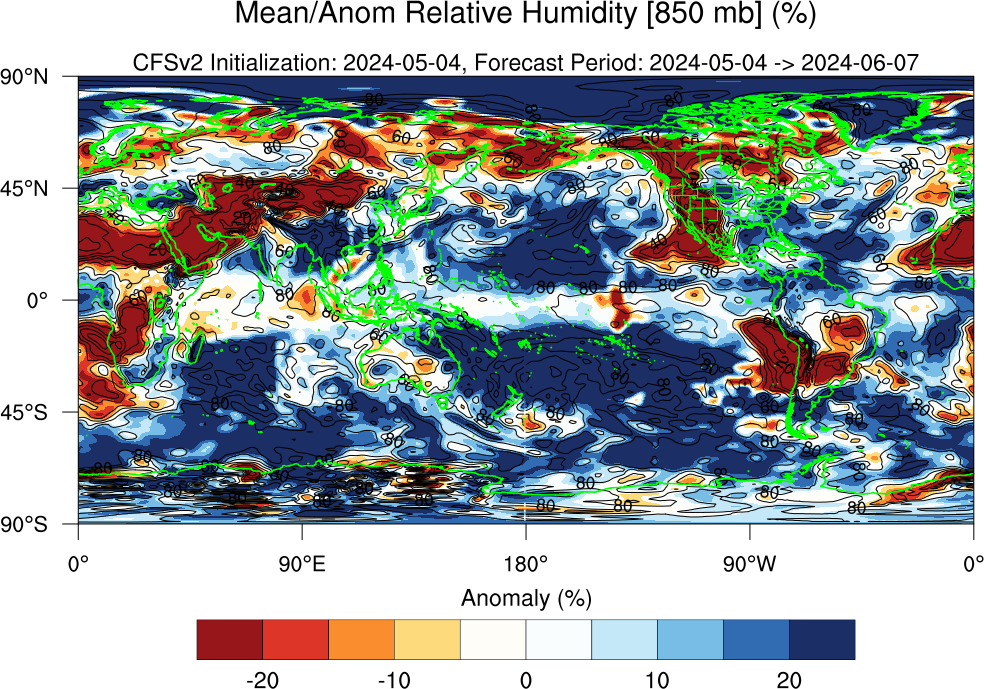
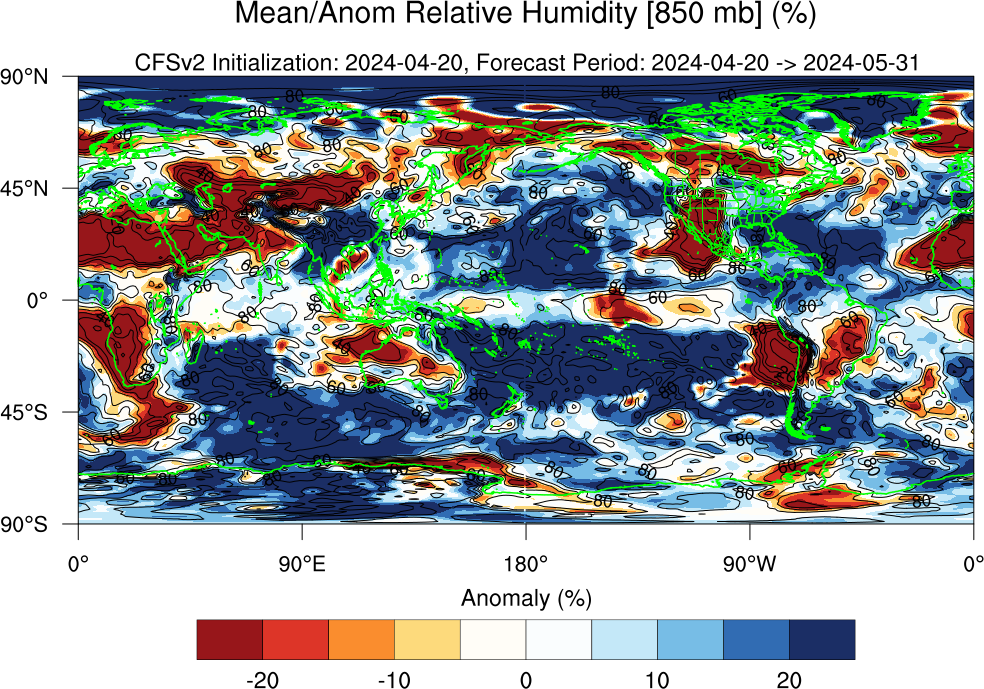
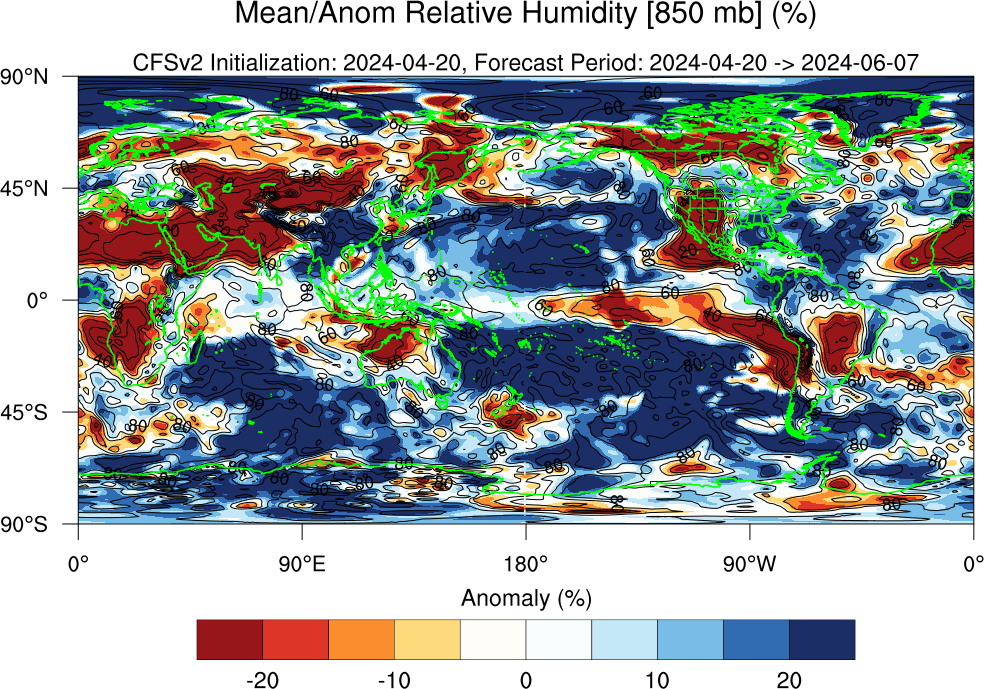
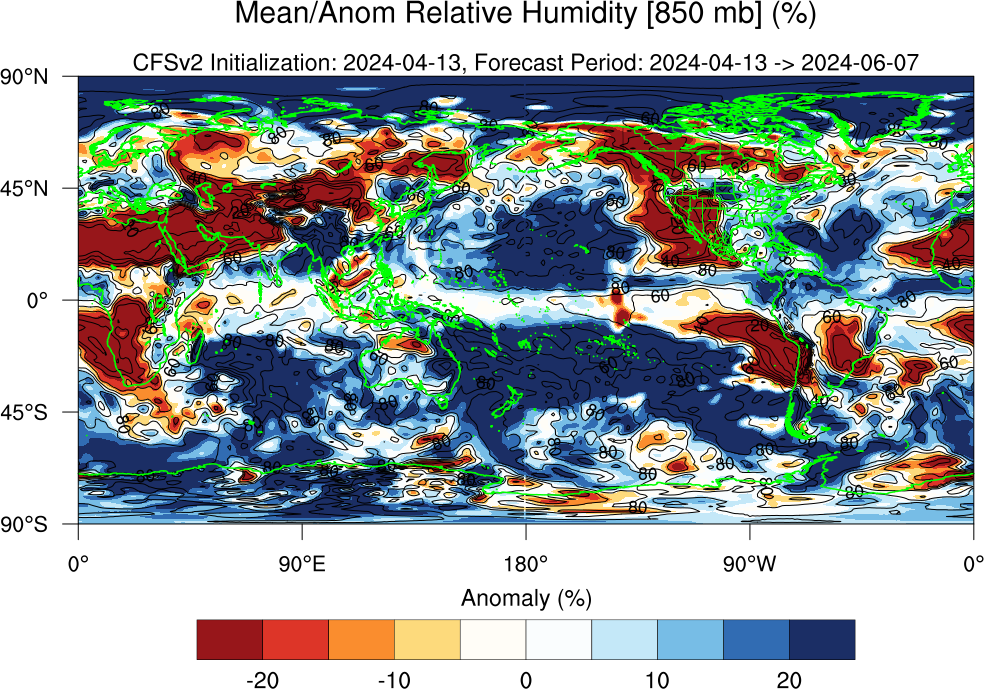
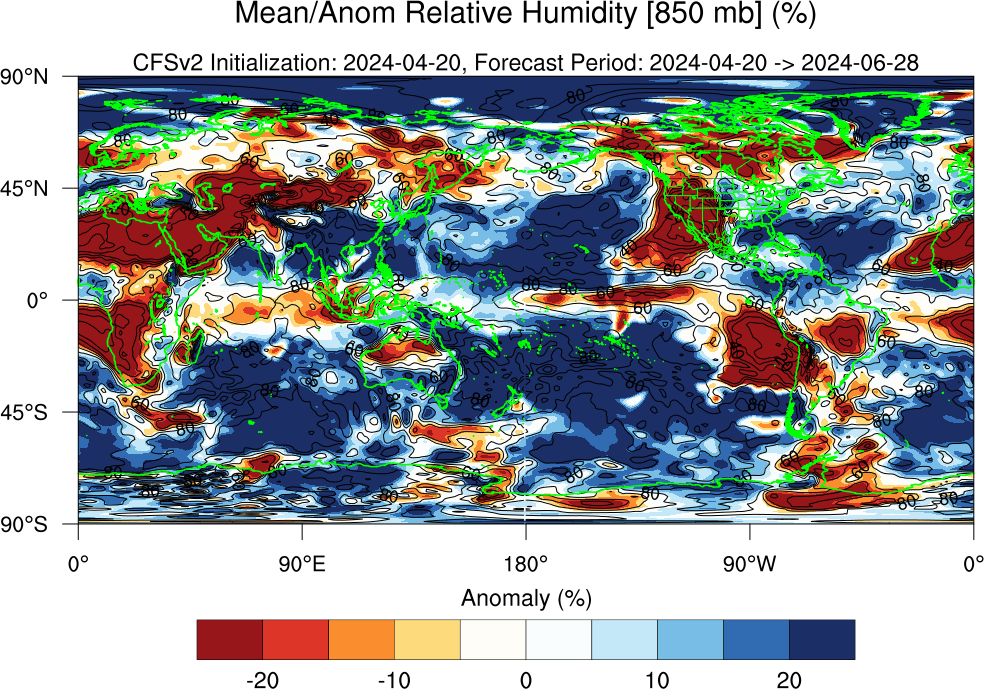
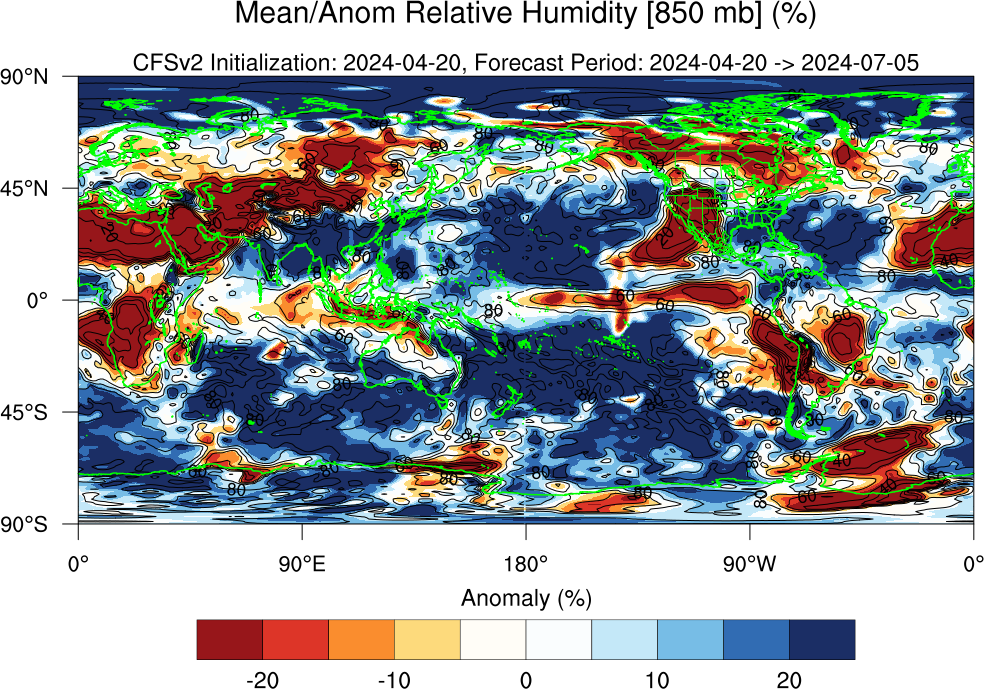
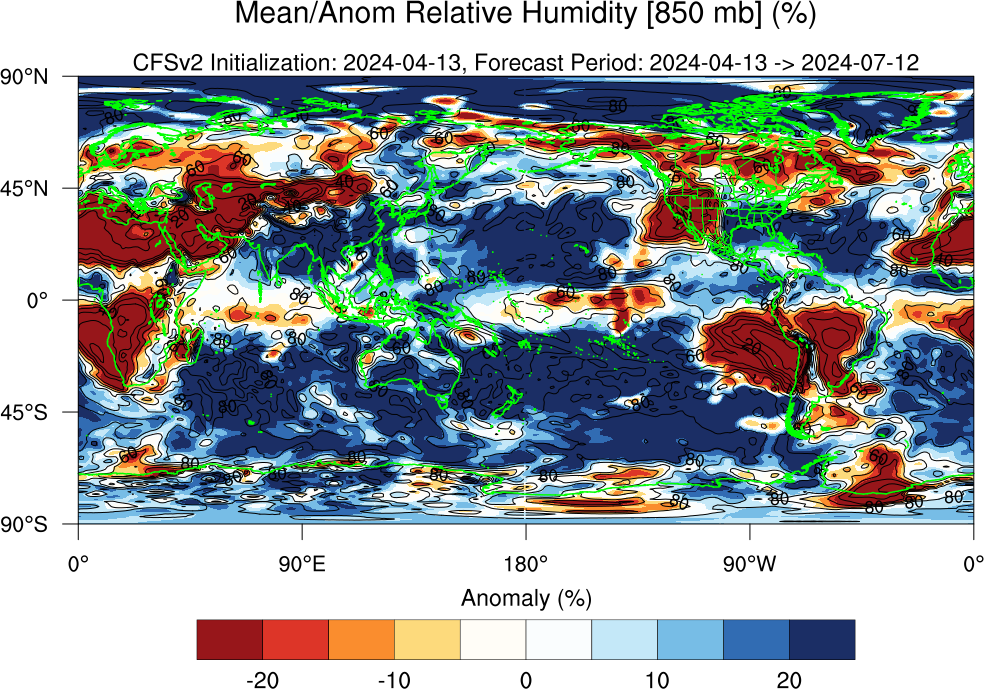
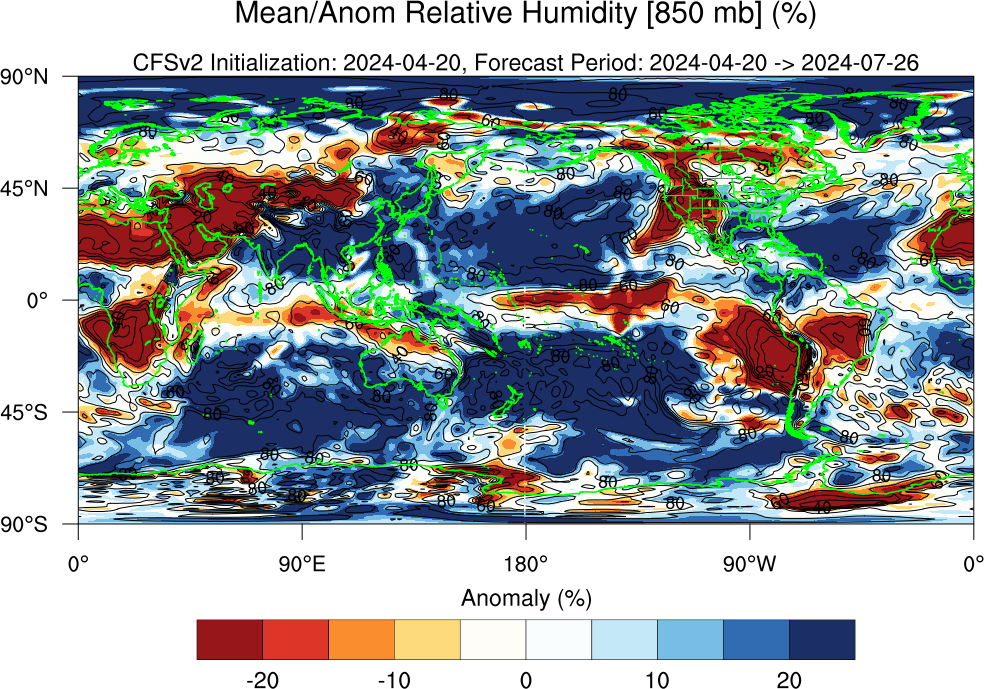
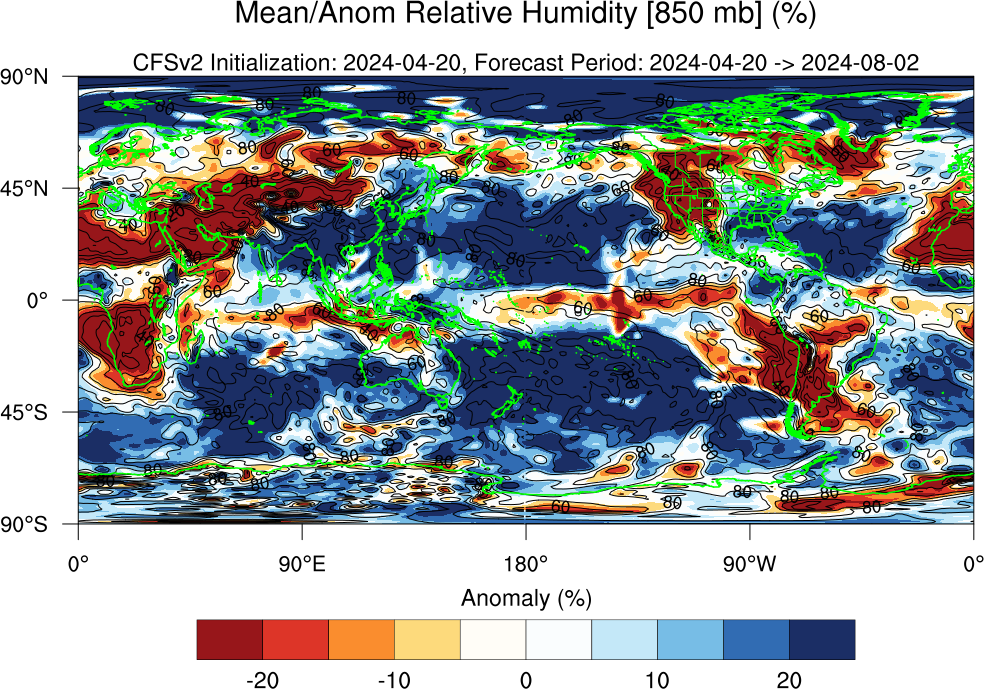
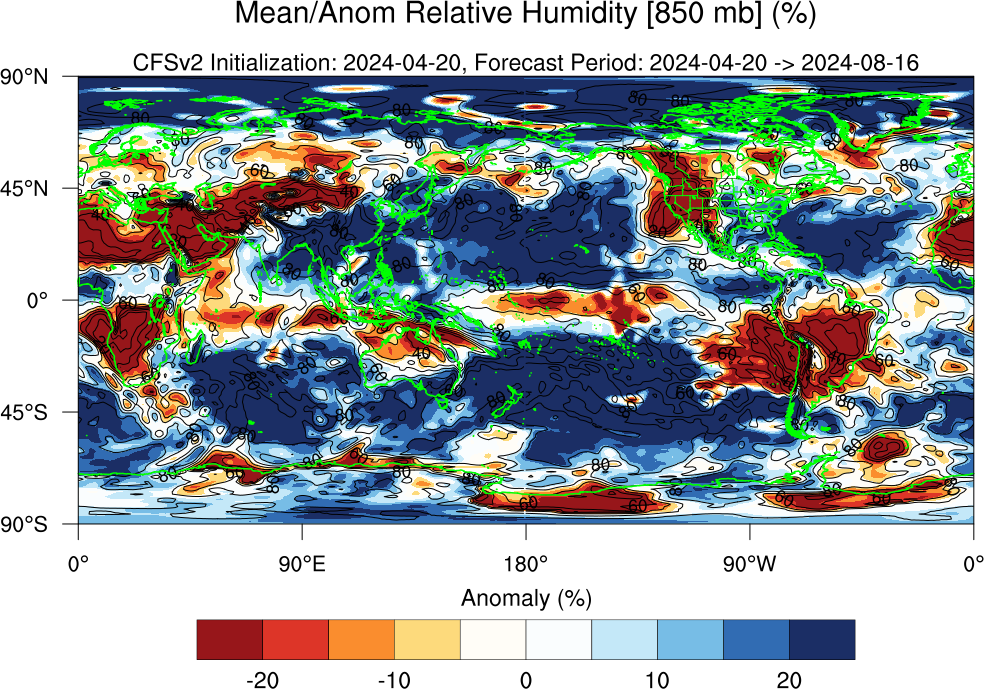
| Mean/Anom Relative Humidity [850 mb] (%) | Loop | Grid | 18Jul | 25Jul | 01Aug | 08Aug | 15Aug | 22Aug | 29Aug | 05Sep | 12Sep |
| 19Sep | 26Sep | 03Oct | 10Oct | 17Oct | 24Oct | 31Oct | 07Nov | 14Nov | |||
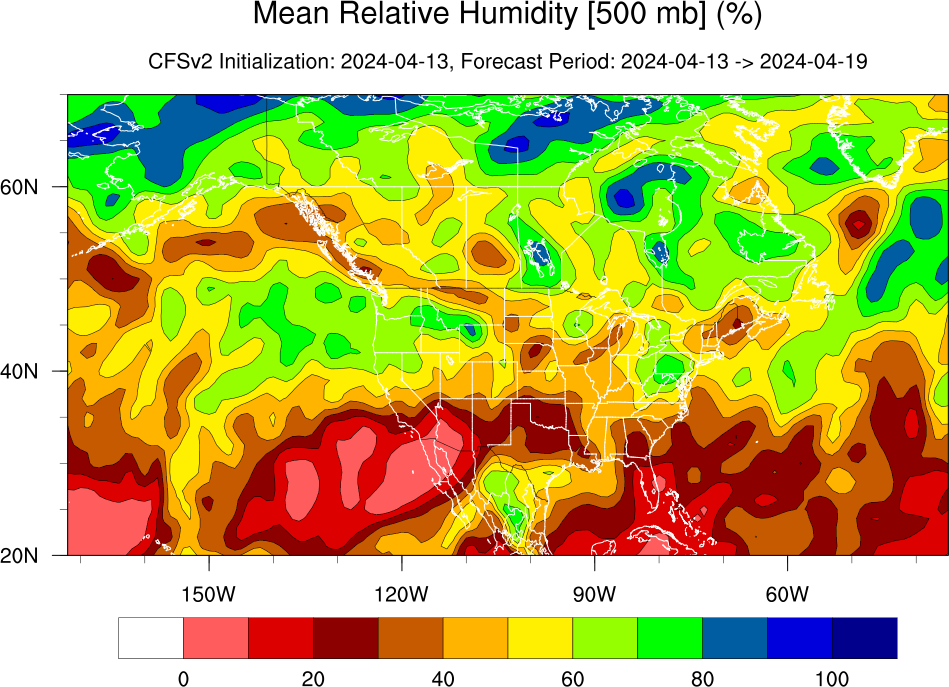
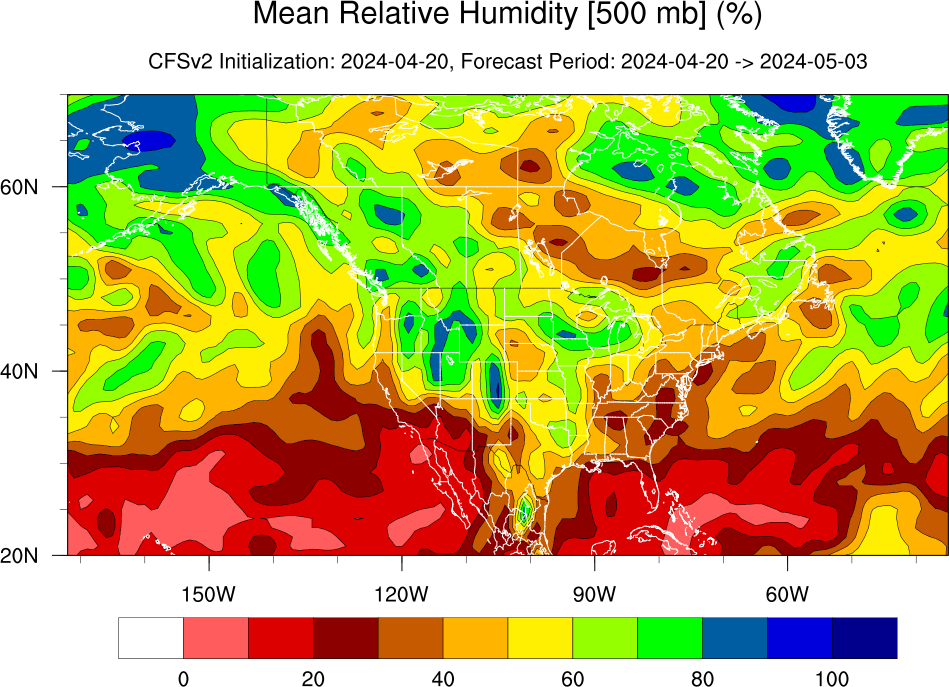
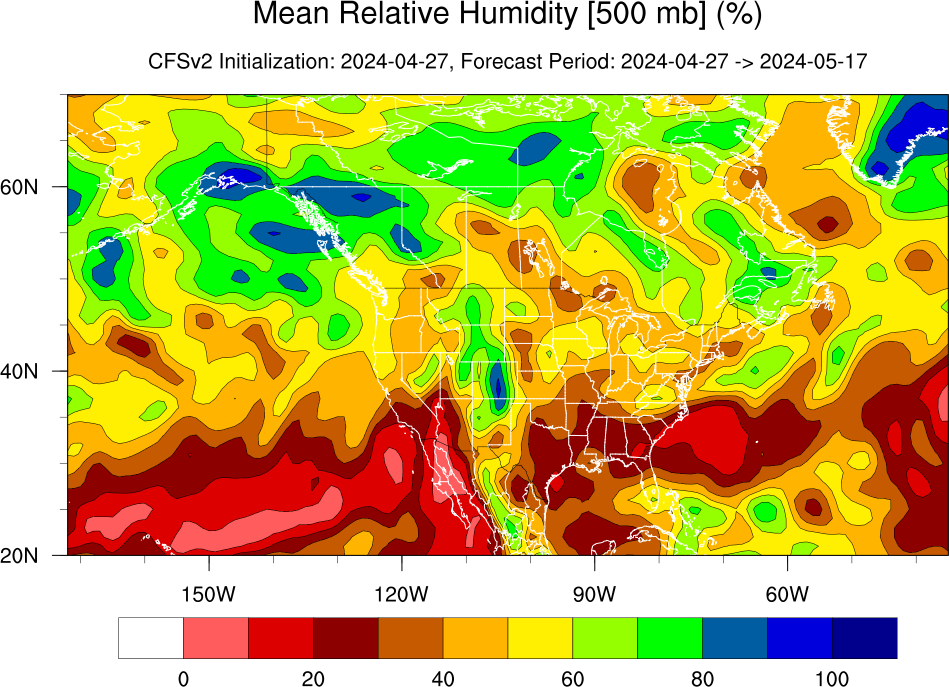
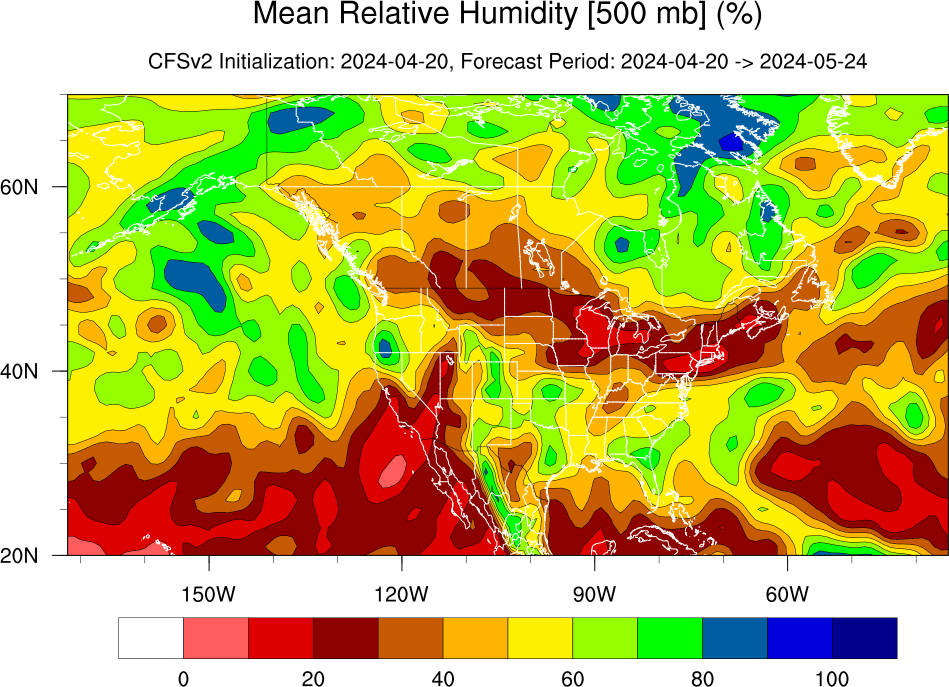
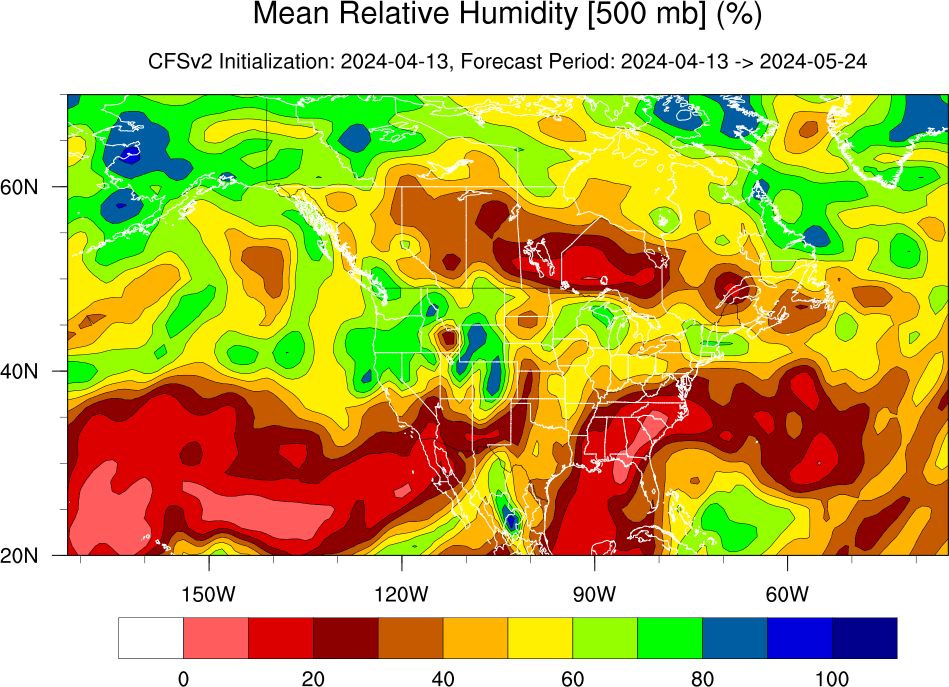
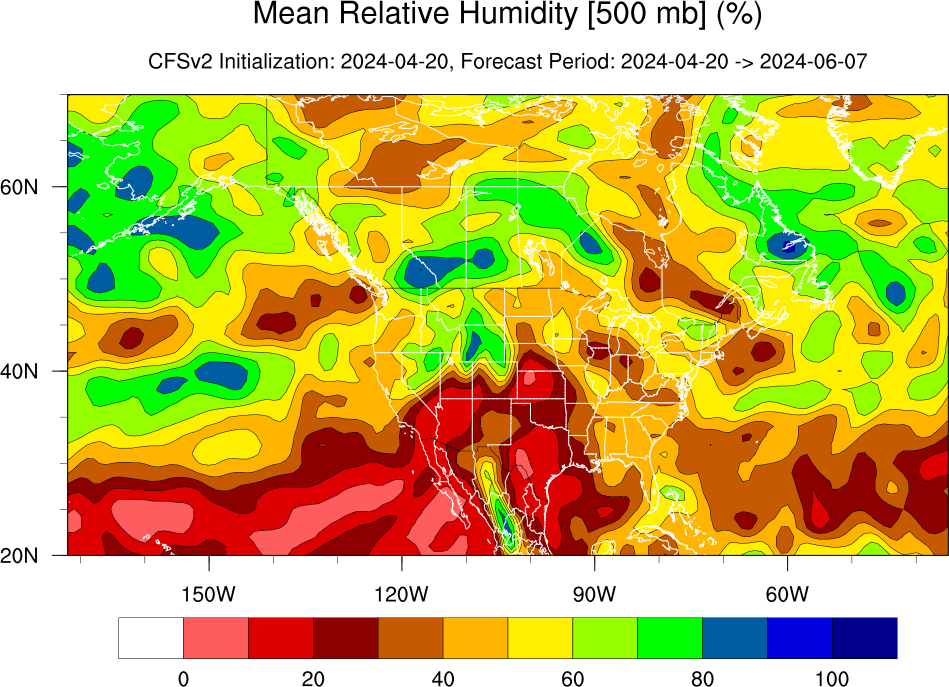
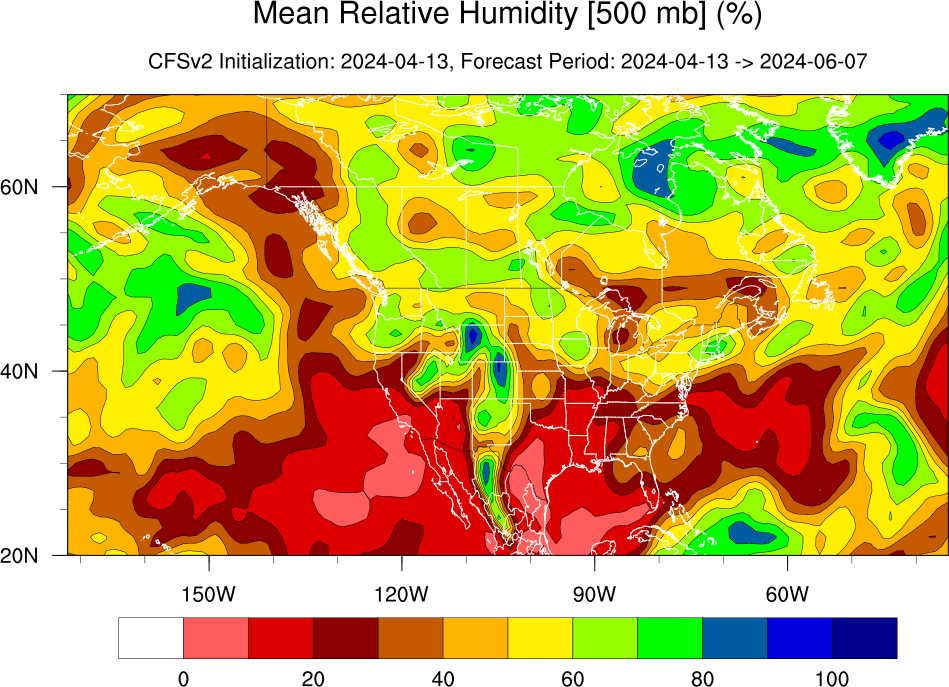
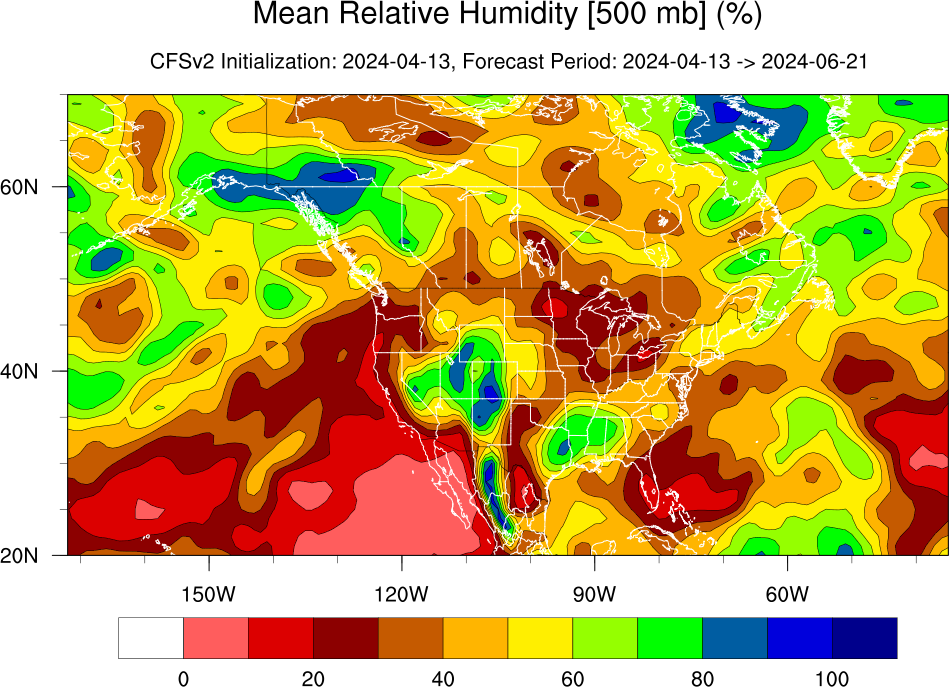
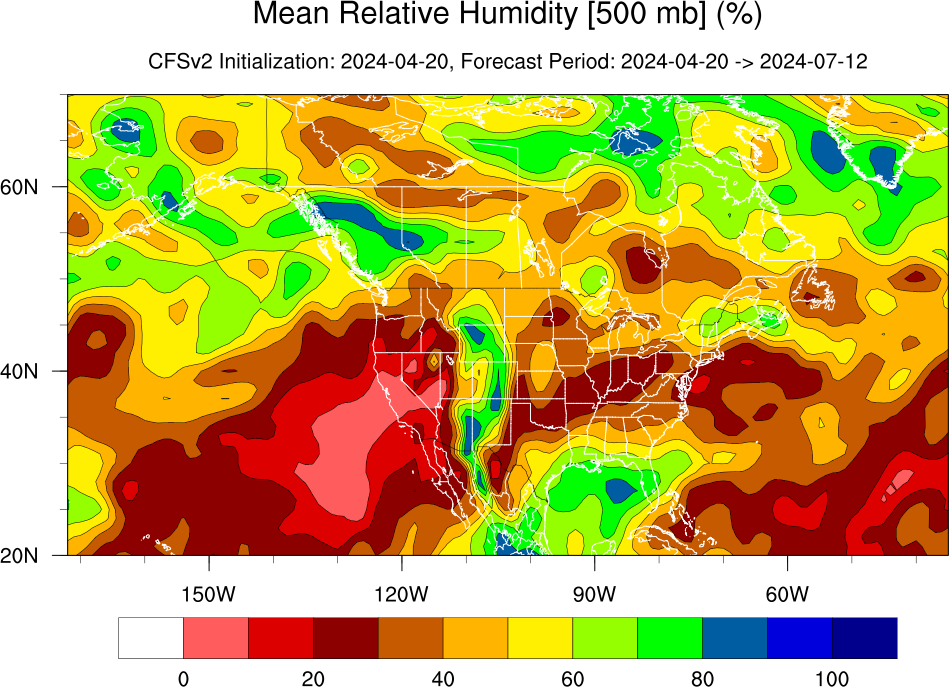
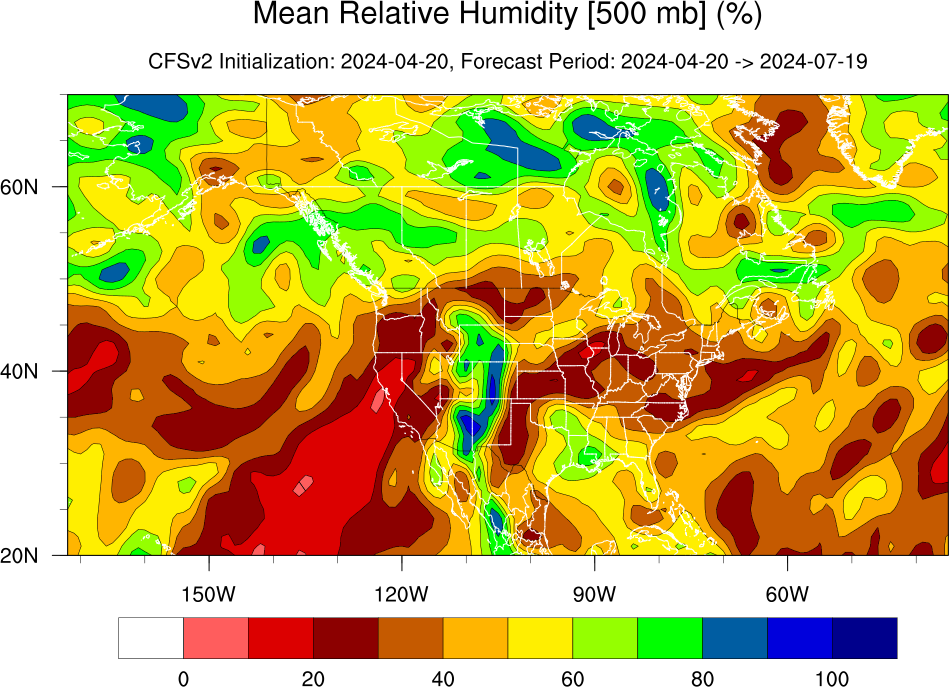
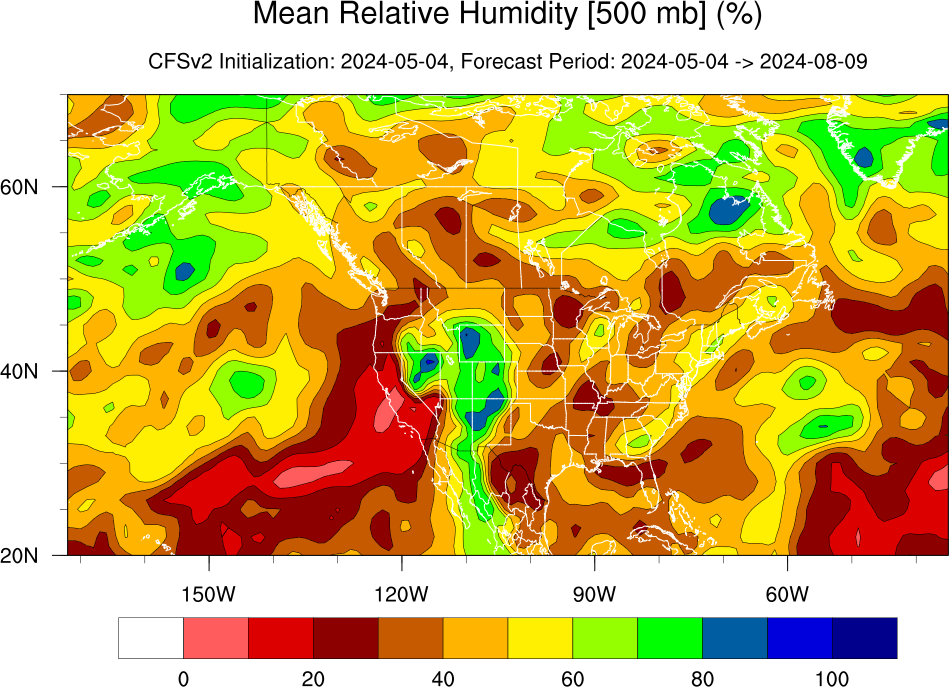
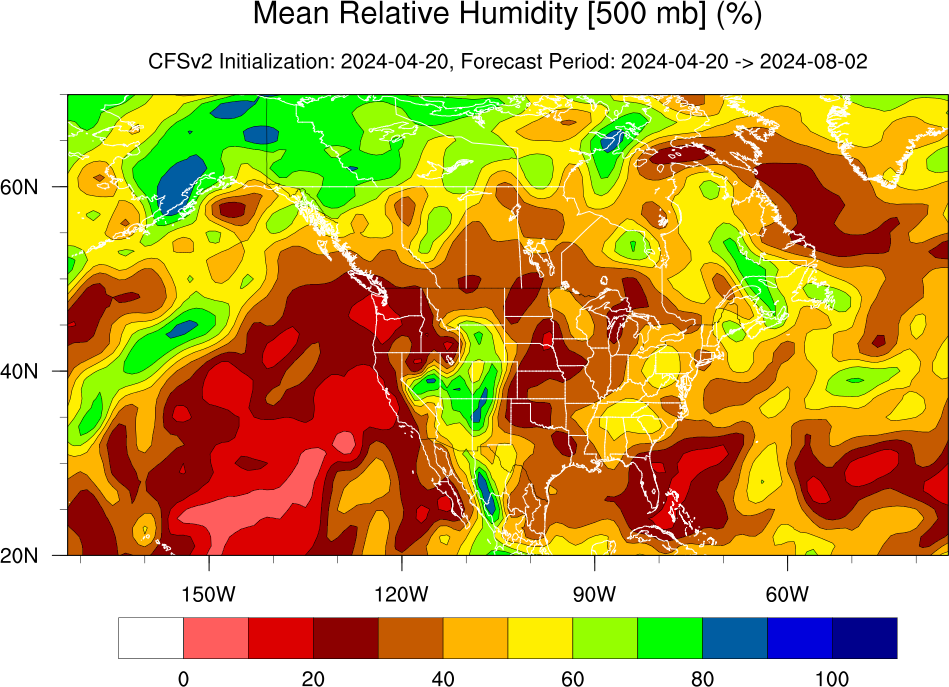
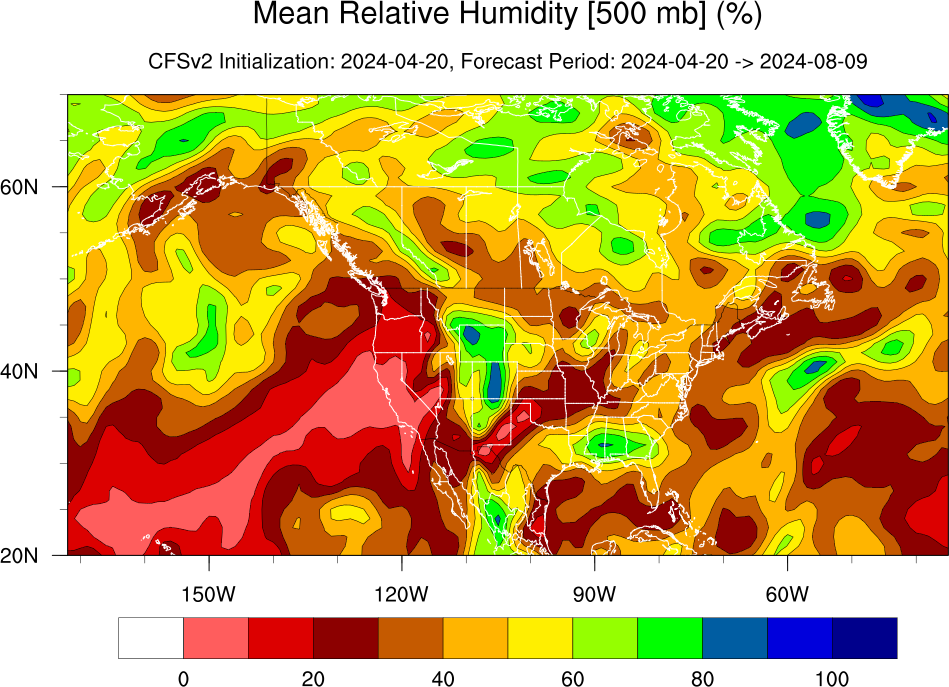
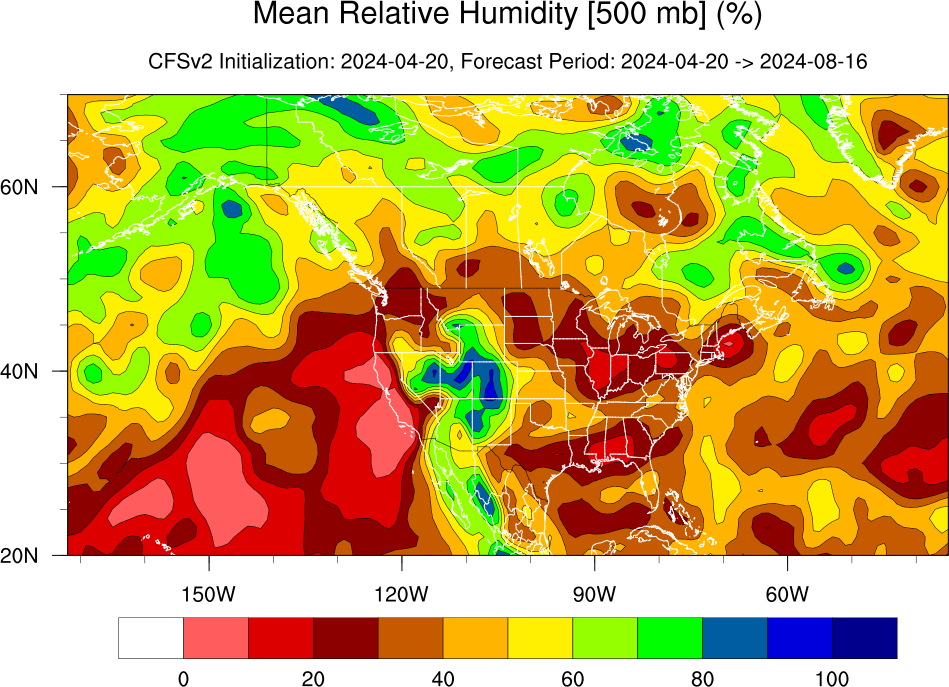
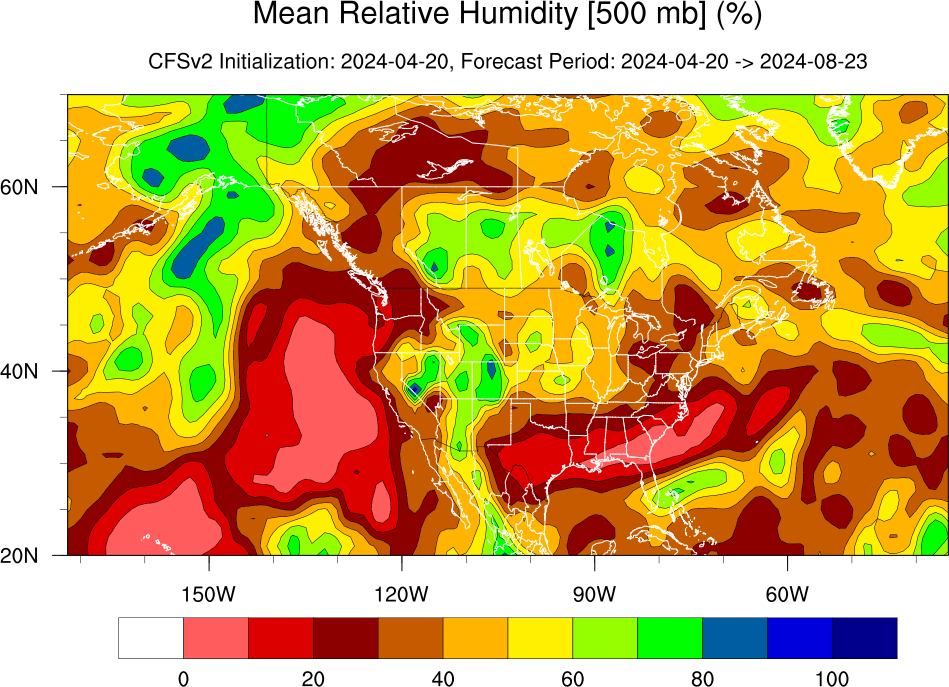
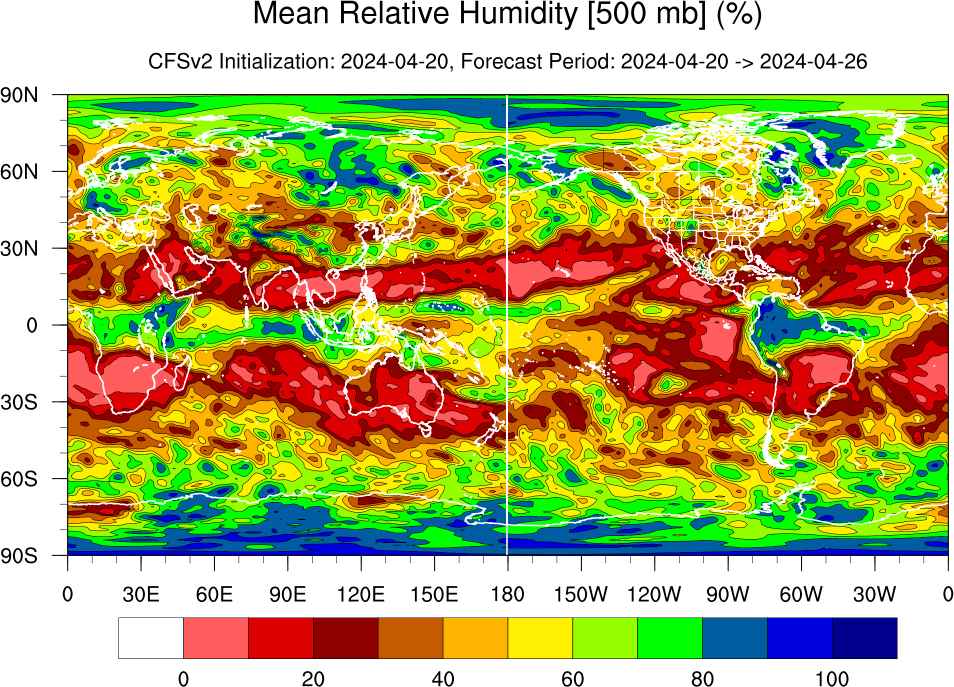
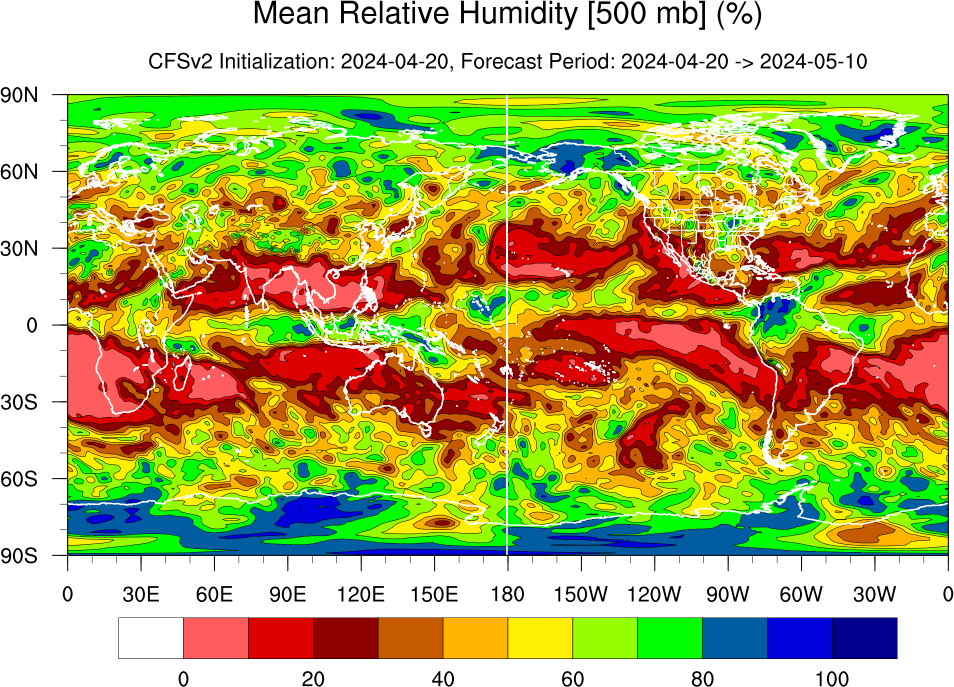
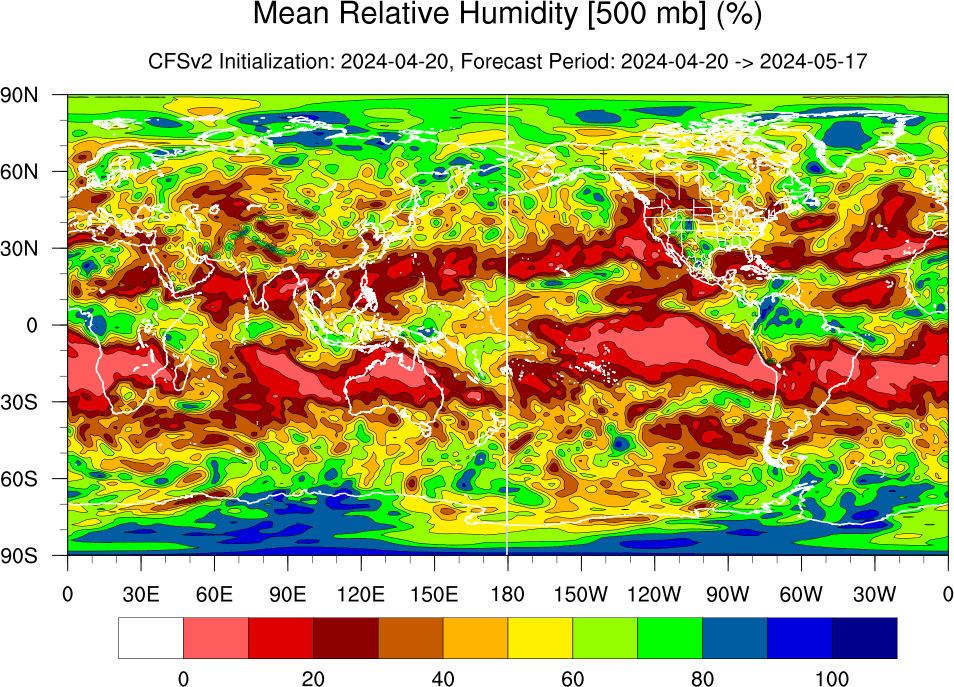
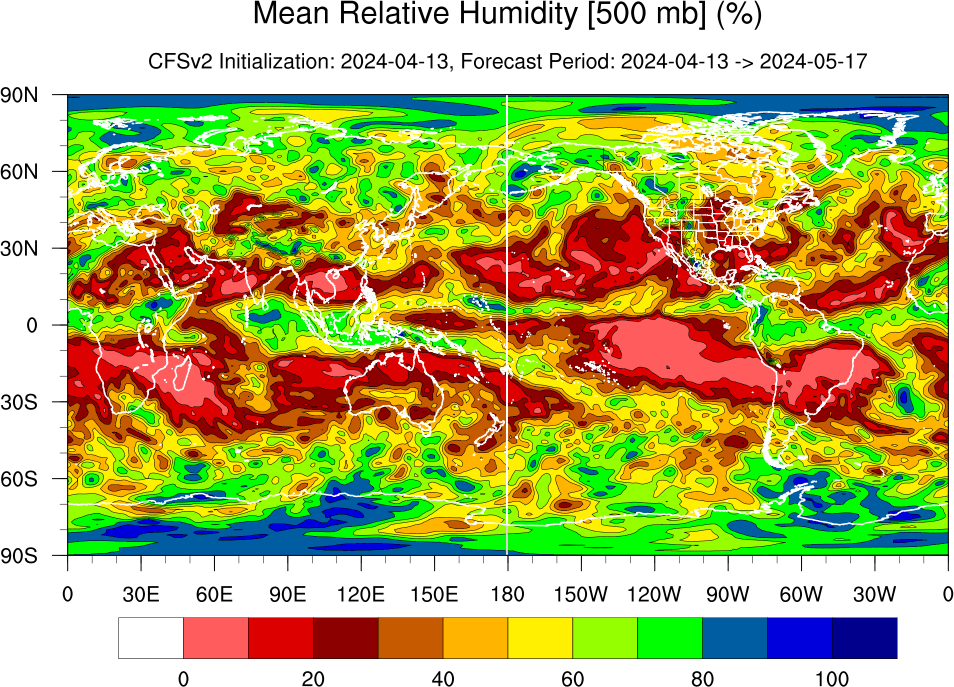
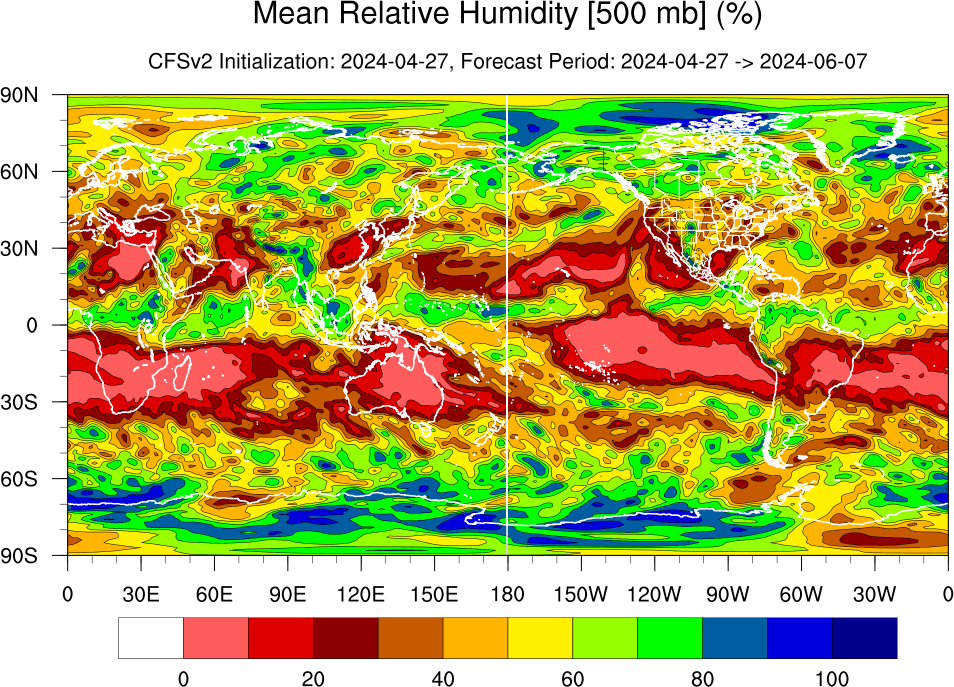
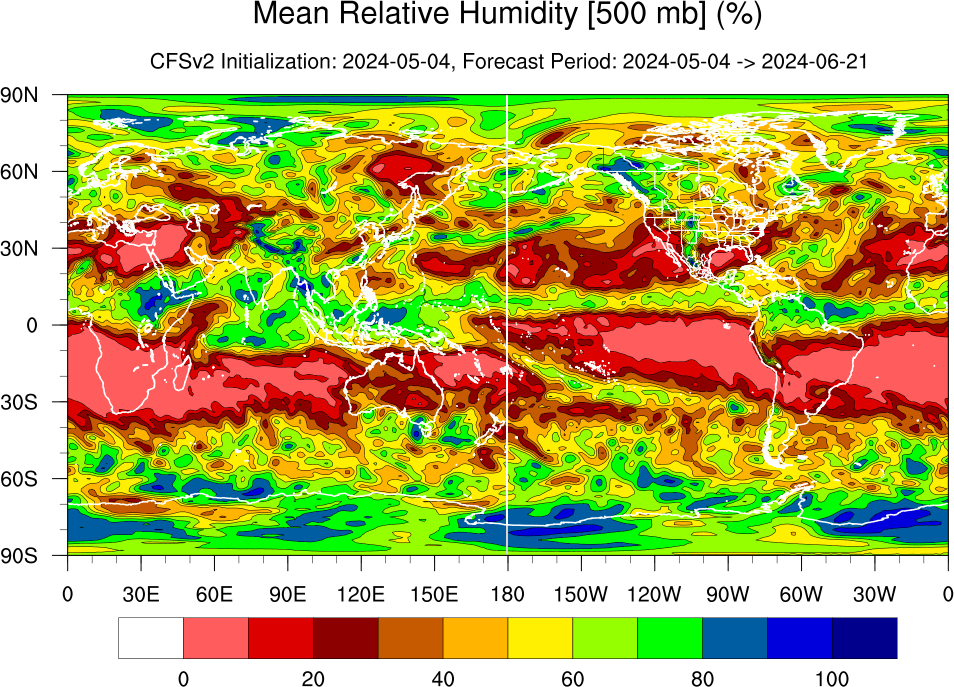
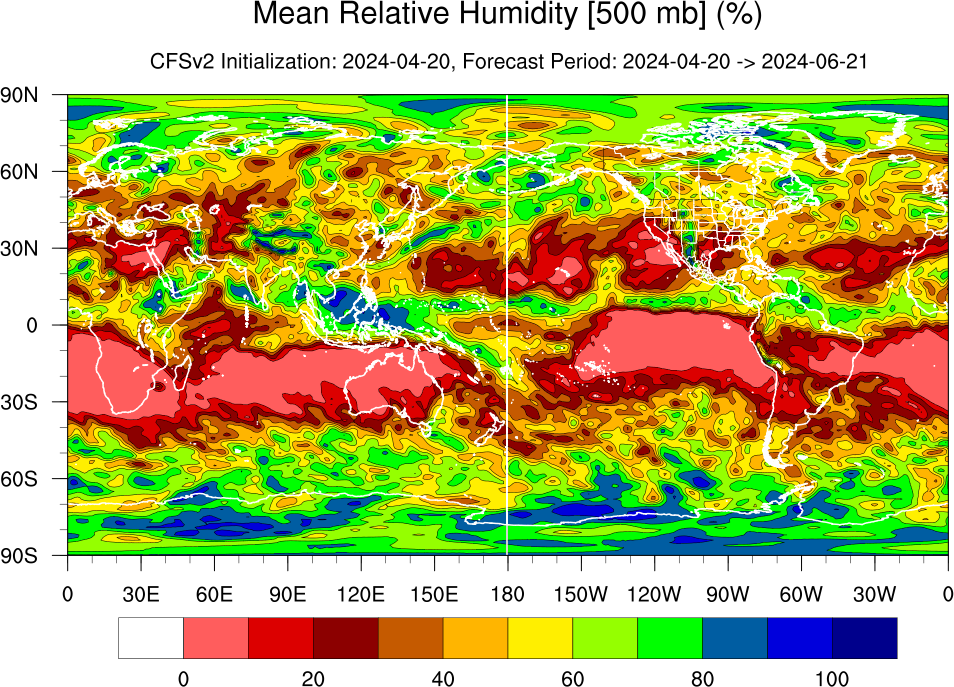
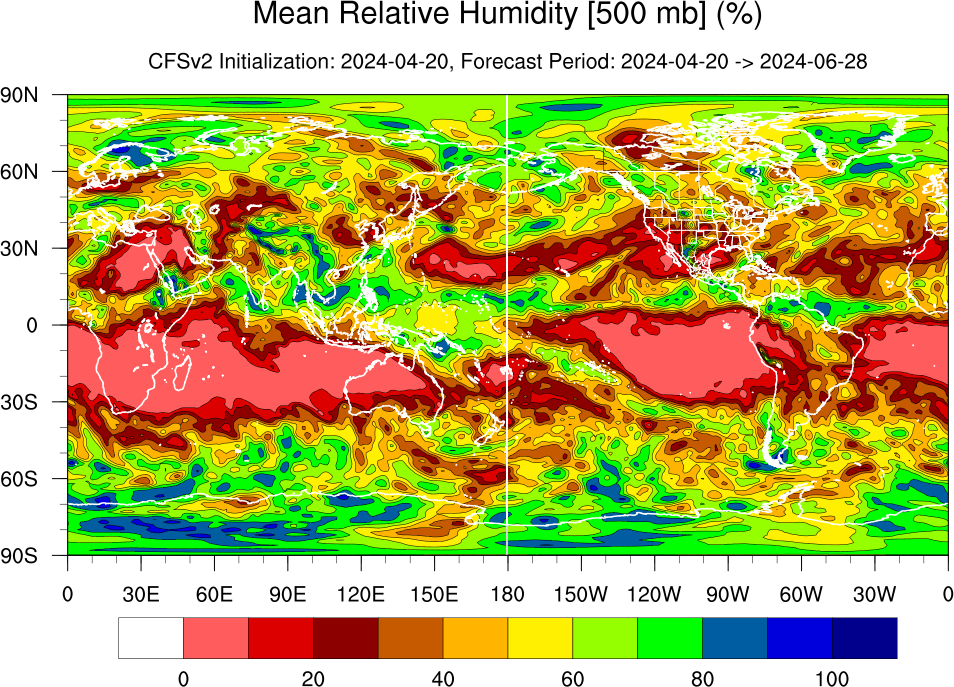
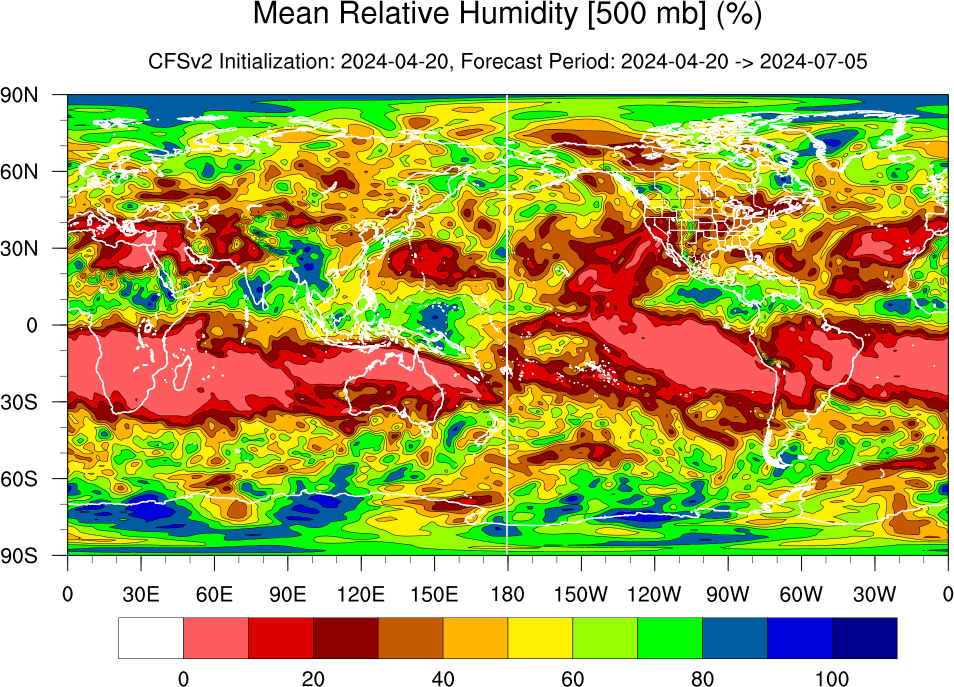
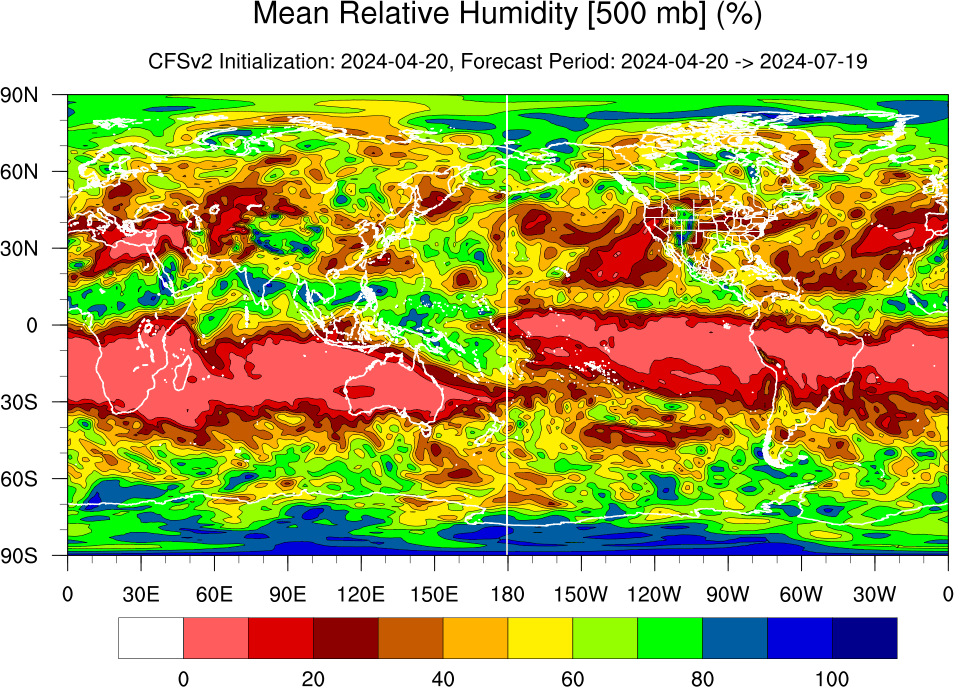
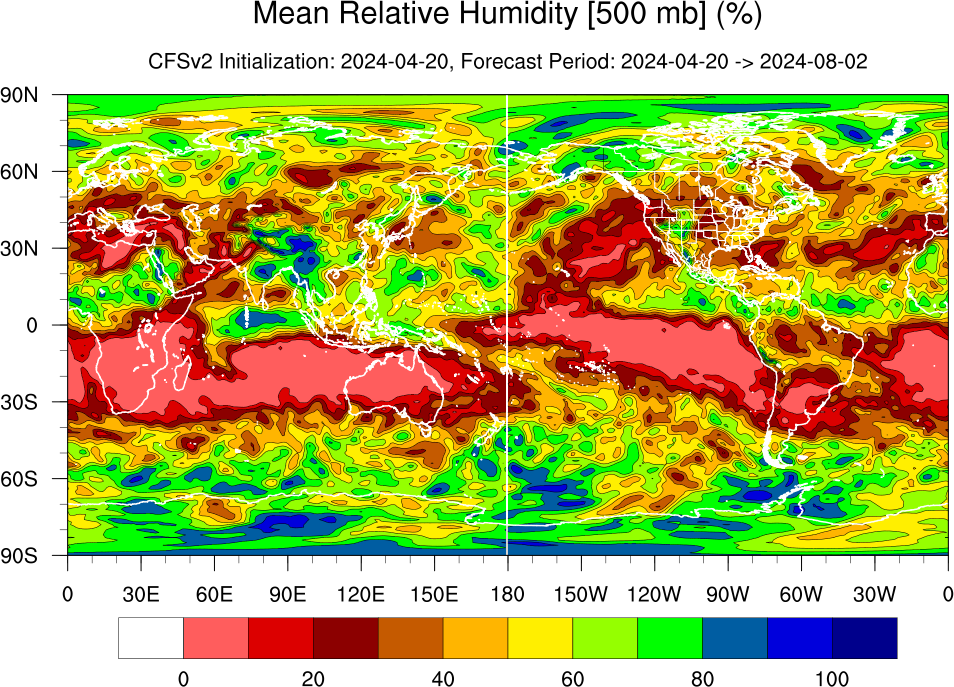
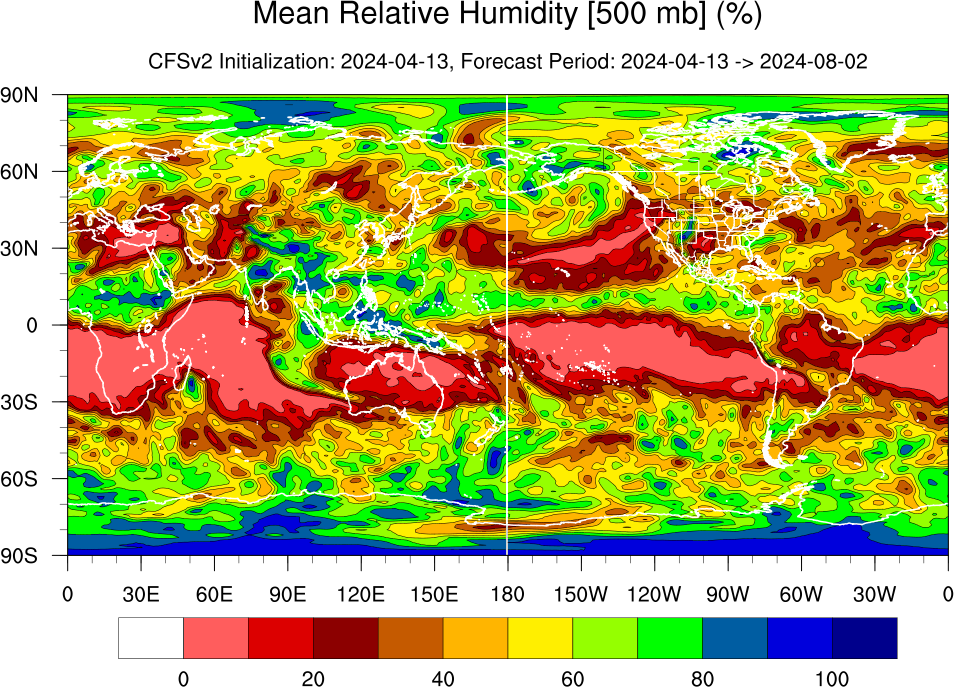
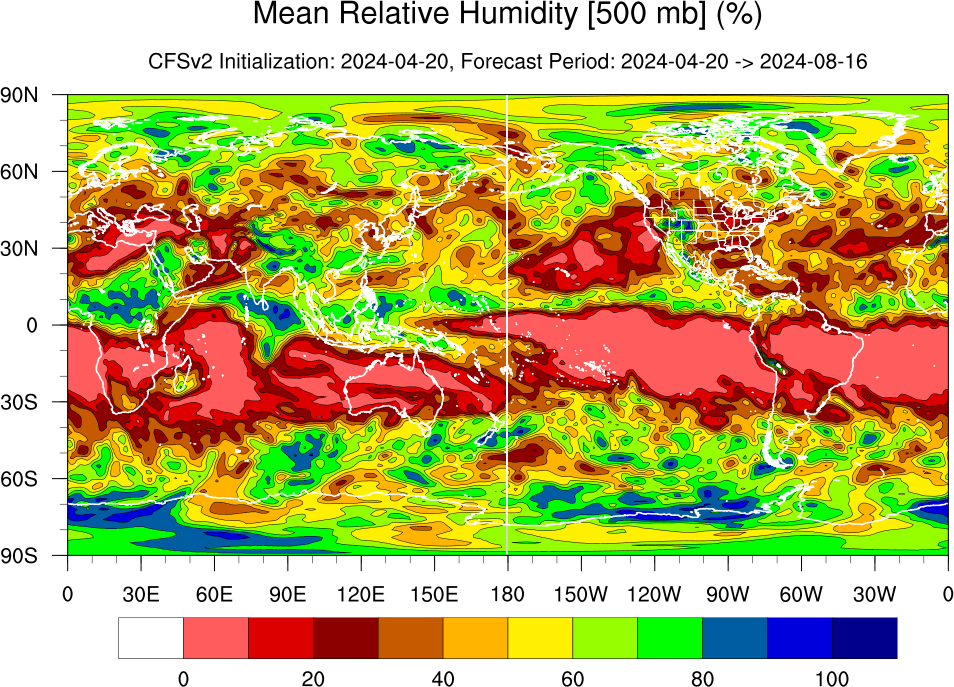
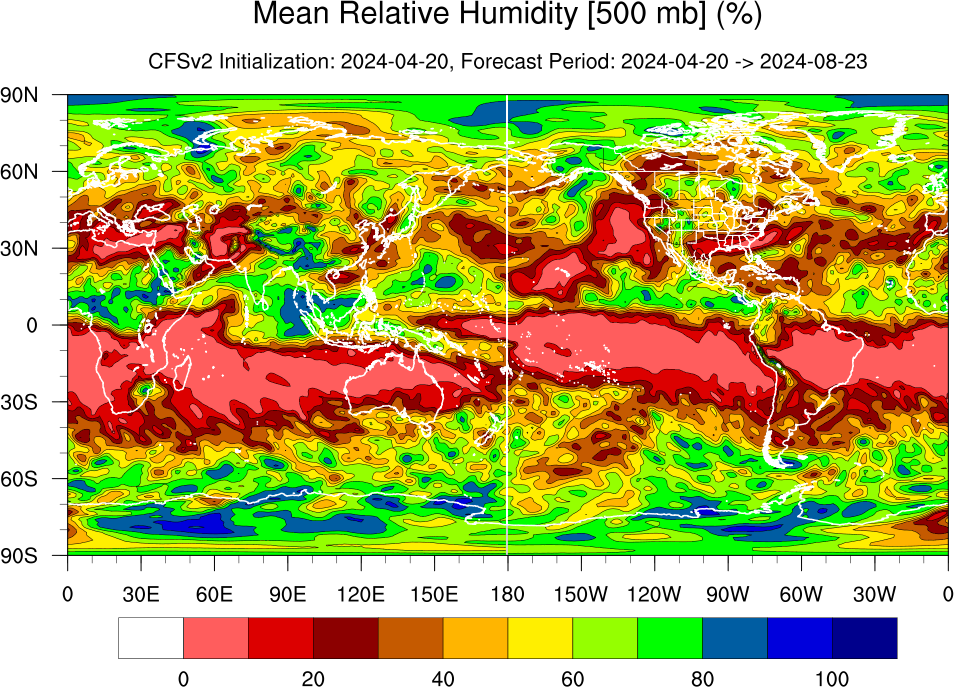
| Mean Relative Humidity [500 mb] (%) | Loop | Grid | 18Jul | 25Jul | 01Aug | 08Aug | 15Aug | 22Aug | 29Aug | 05Sep | 12Sep |
| 19Sep | 26Sep | 03Oct | 10Oct | 17Oct | 24Oct | 31Oct | 07Nov | 14Nov | |||
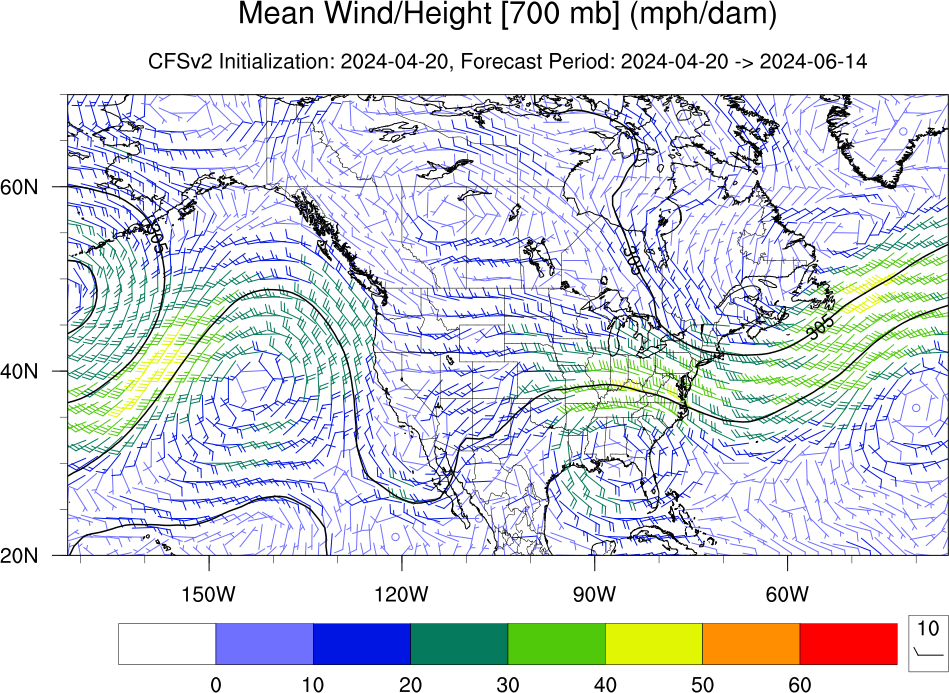
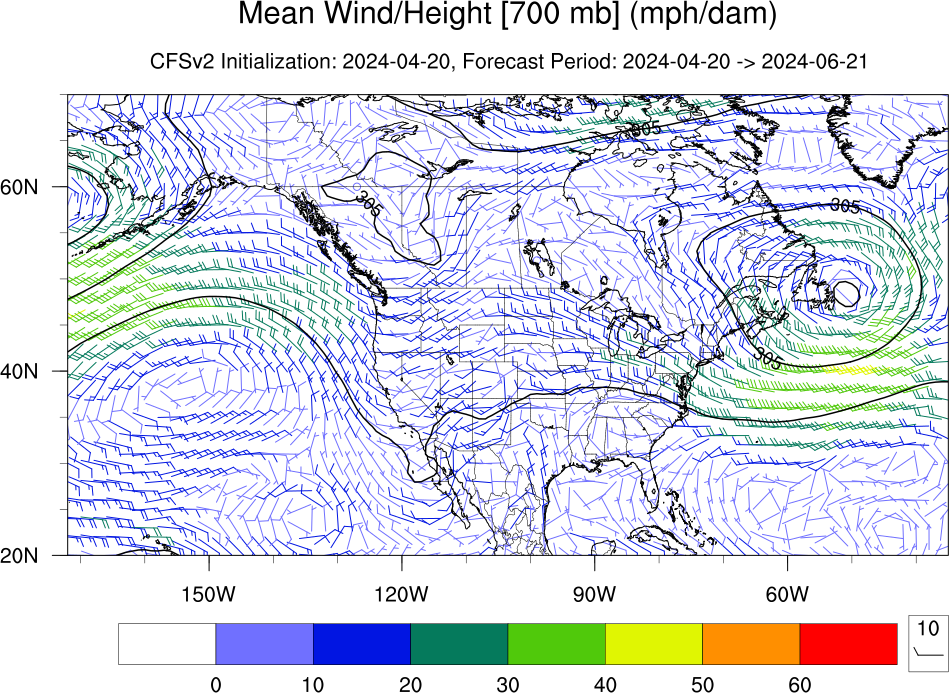
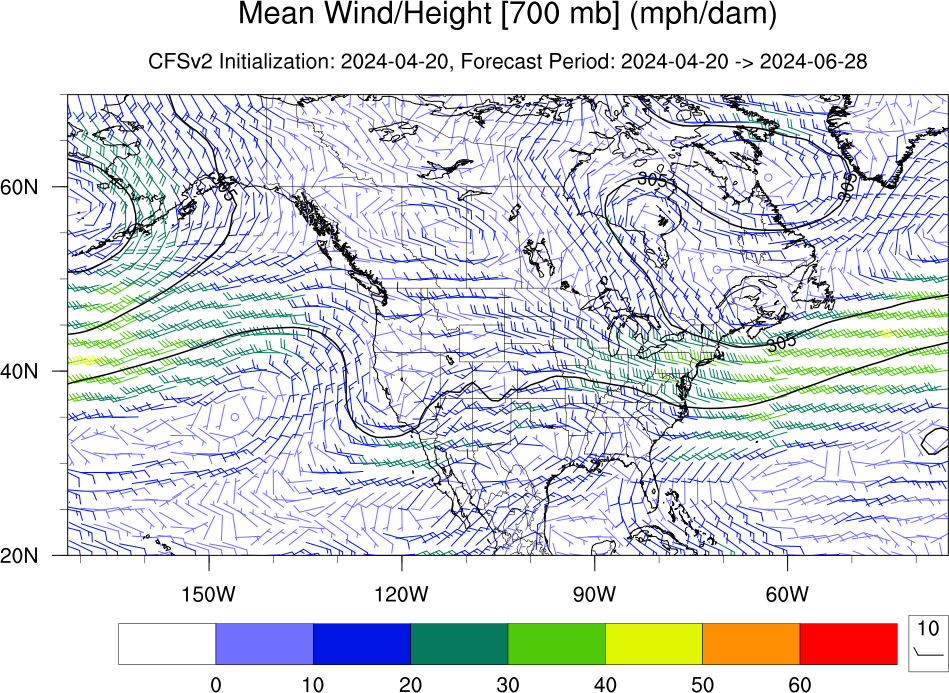
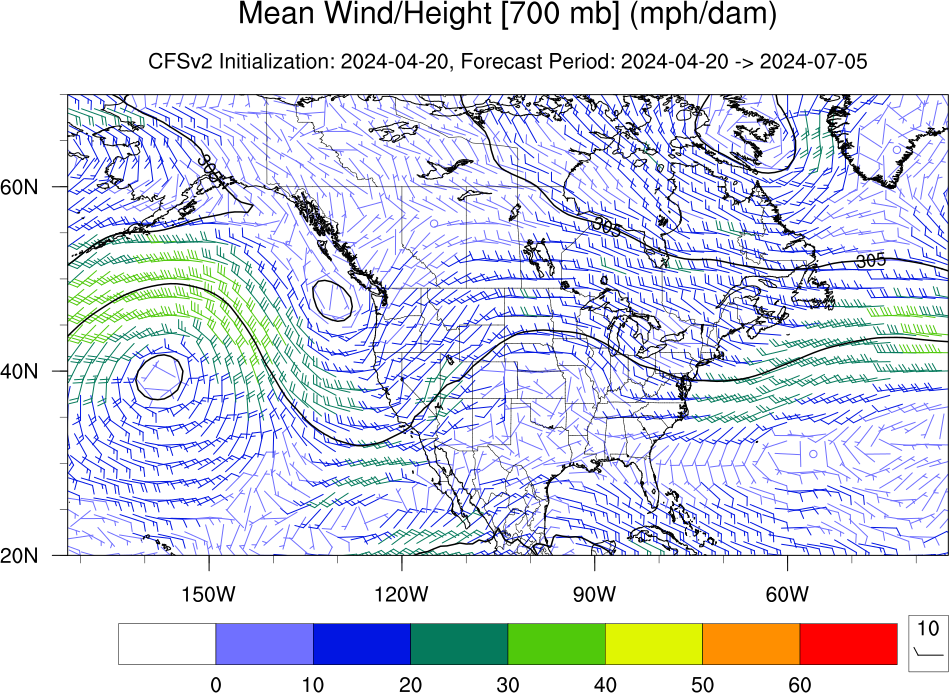
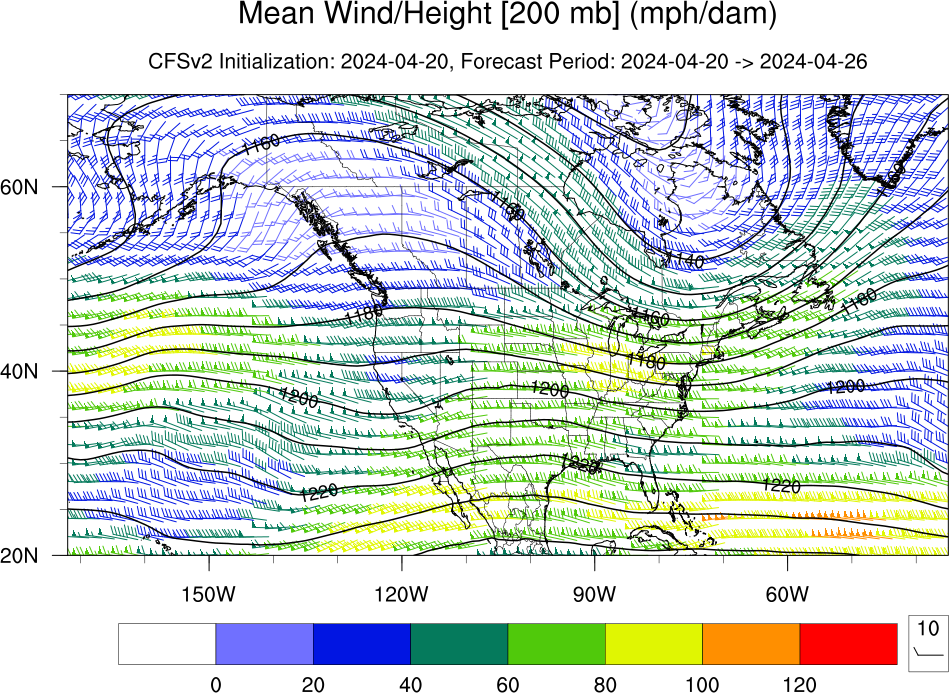
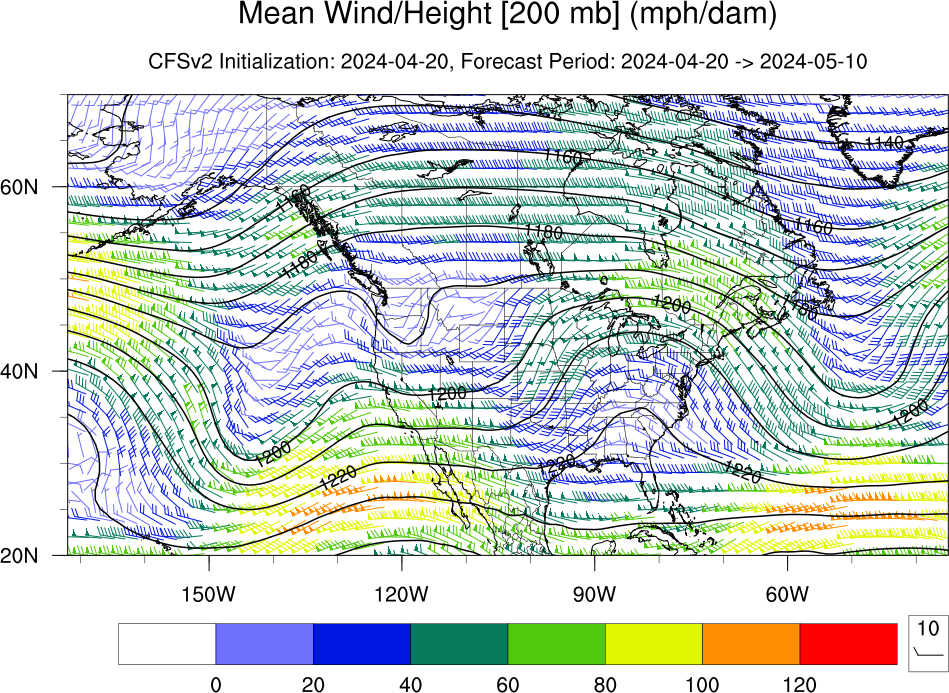
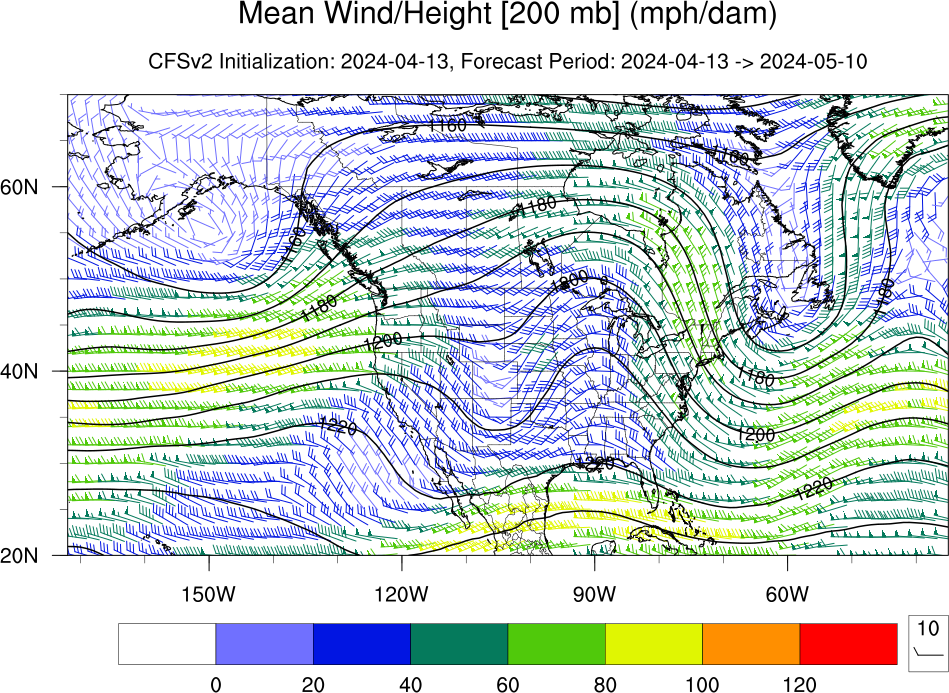
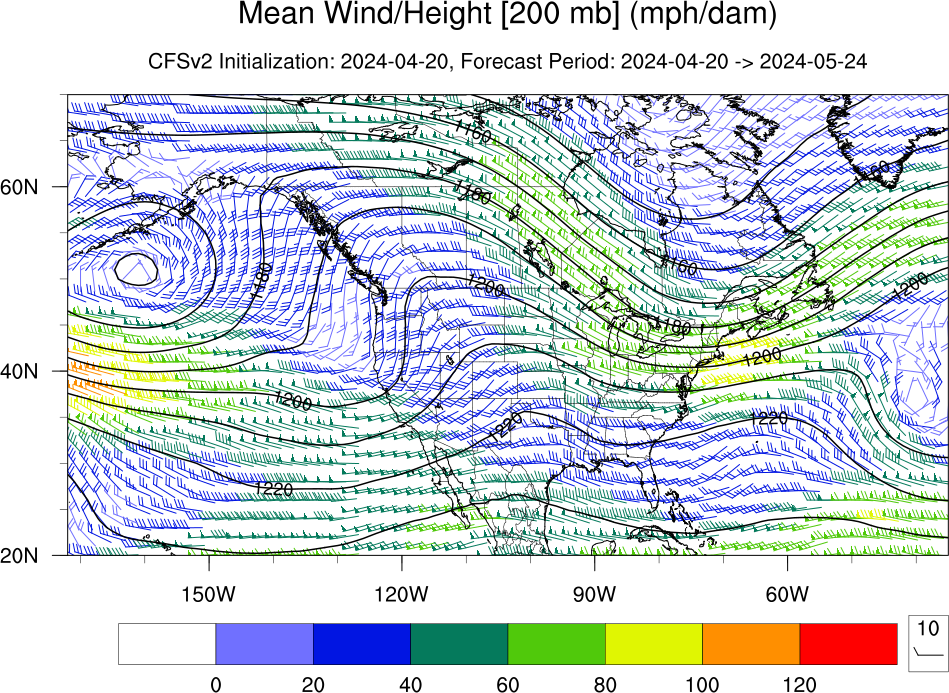
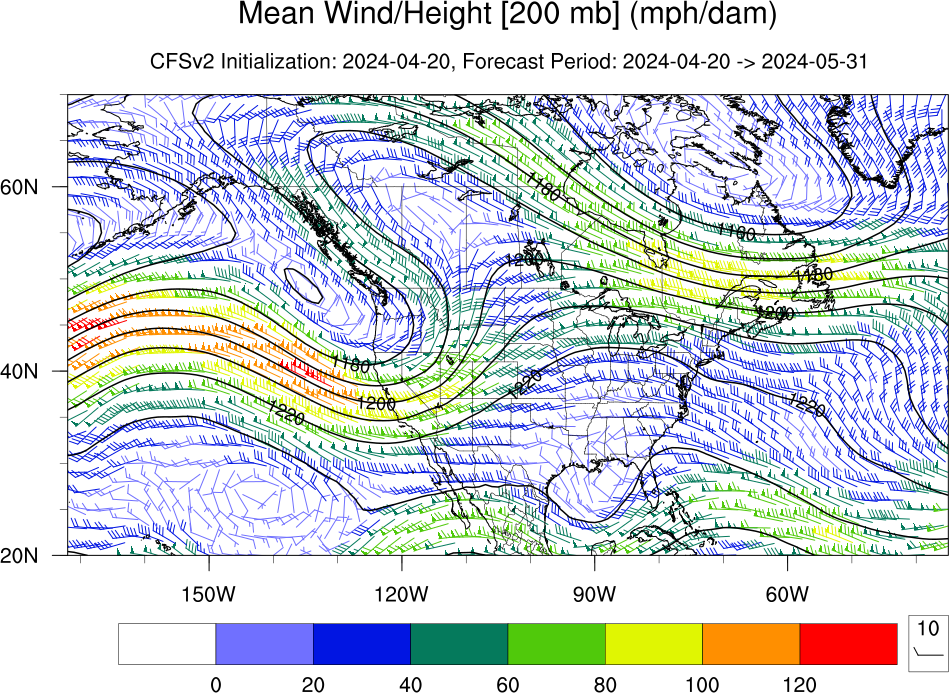
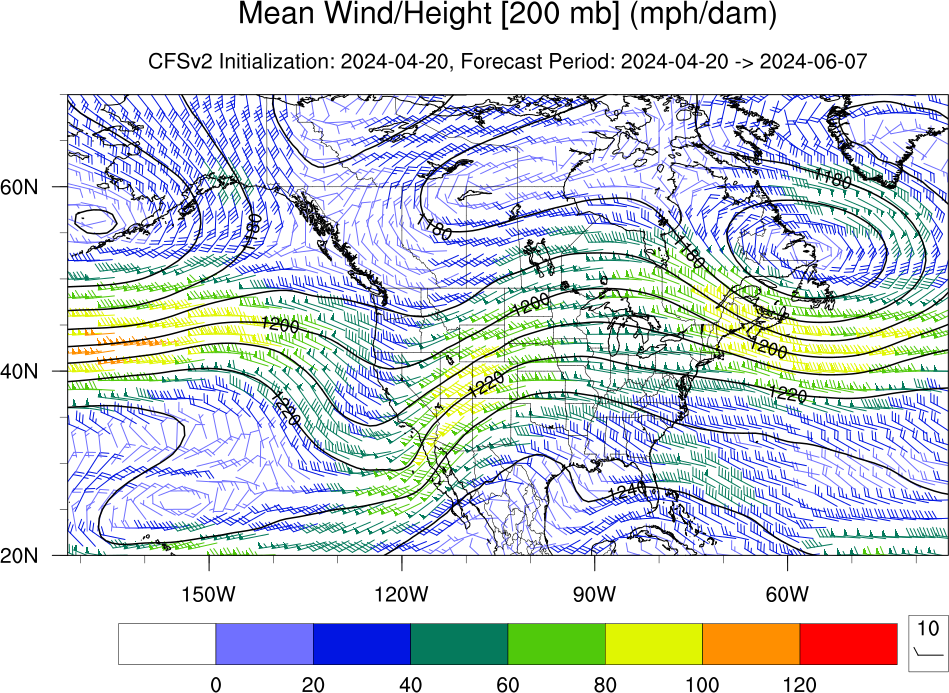
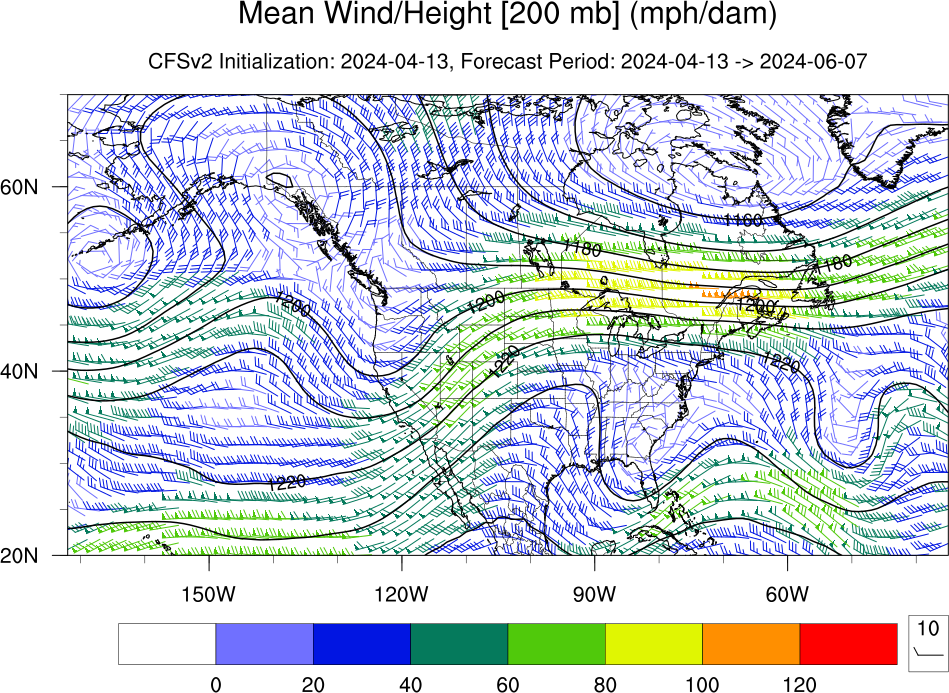
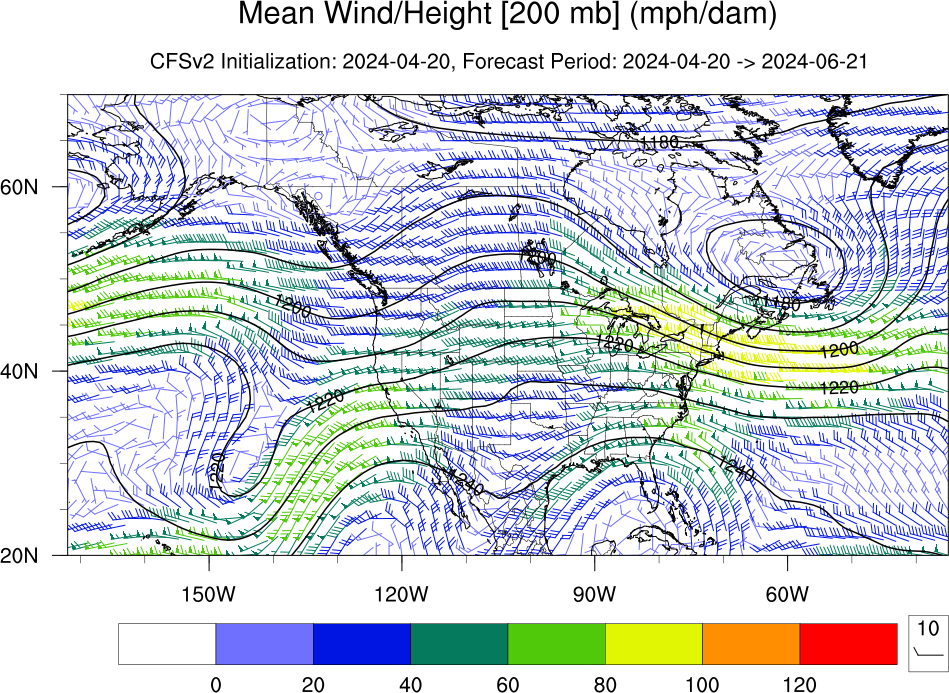
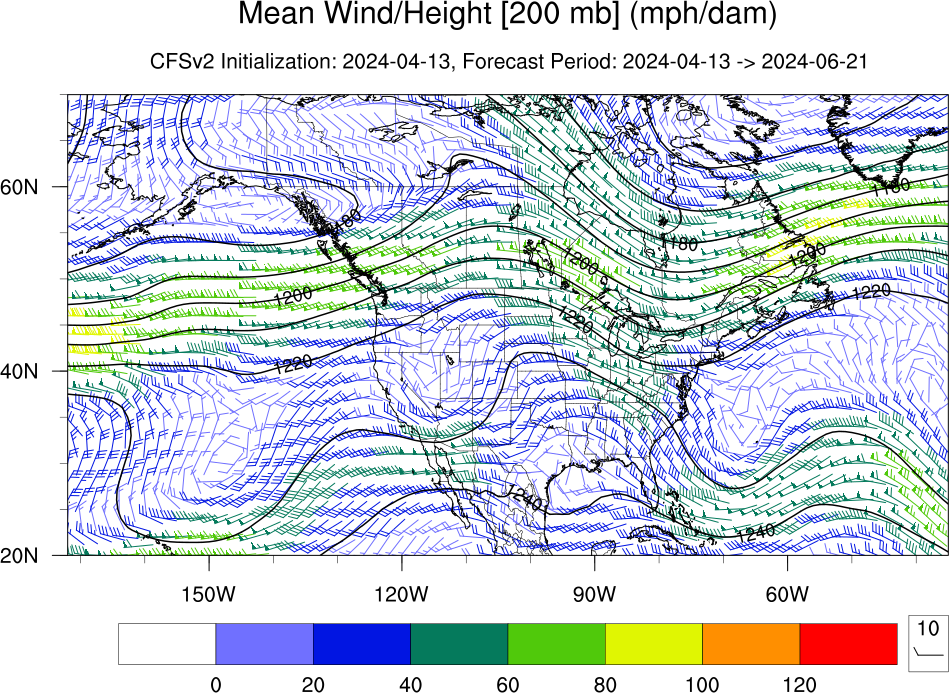
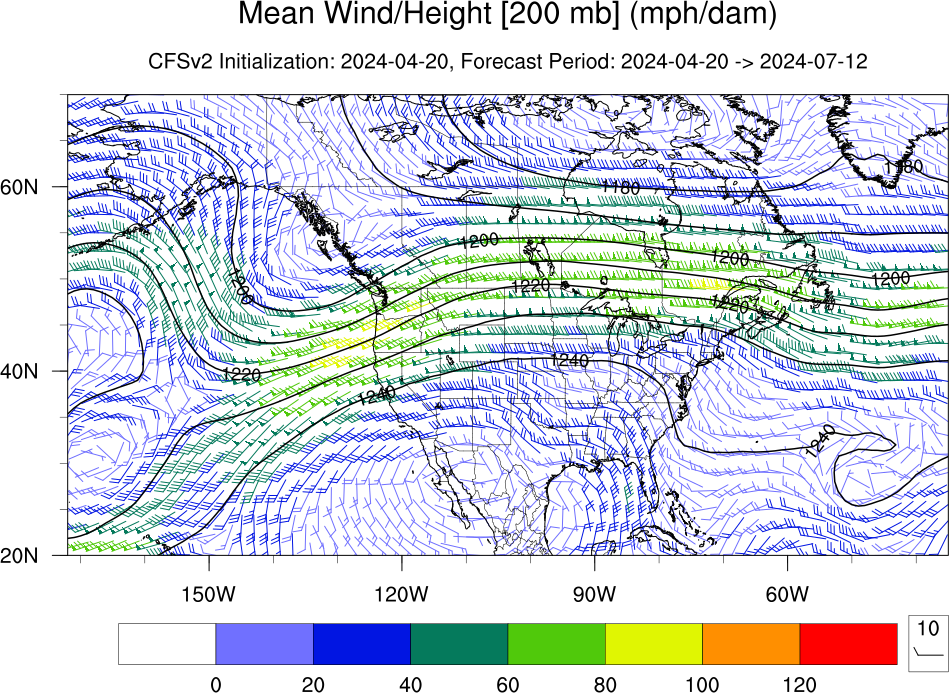
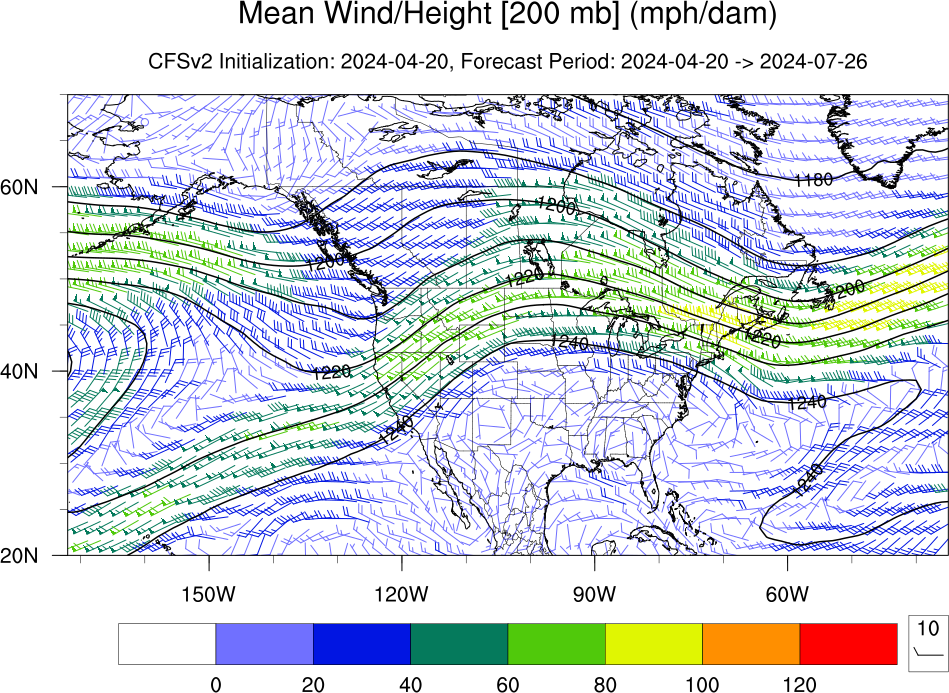
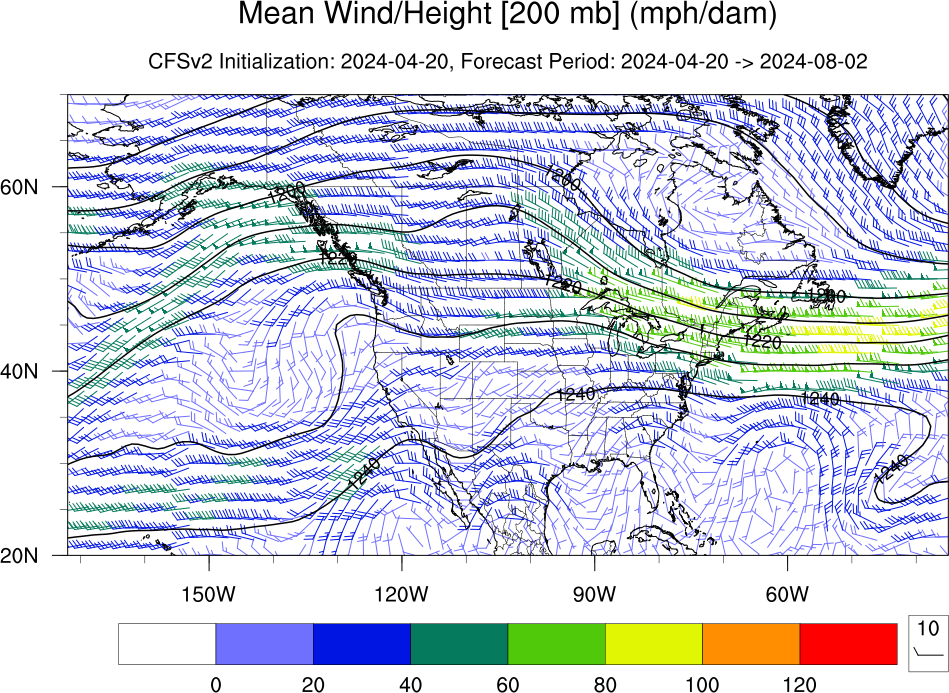
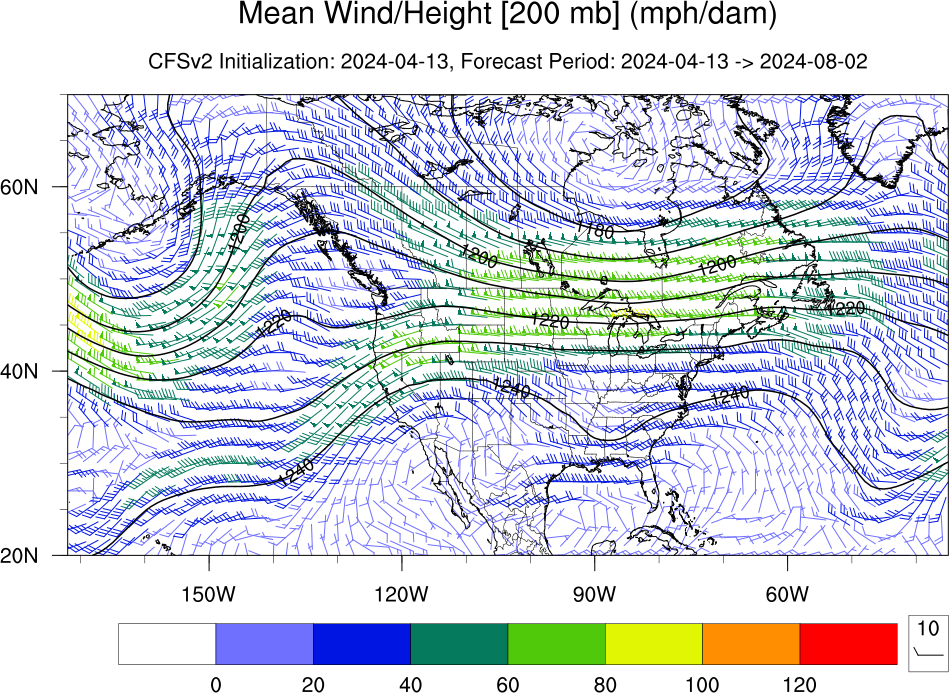
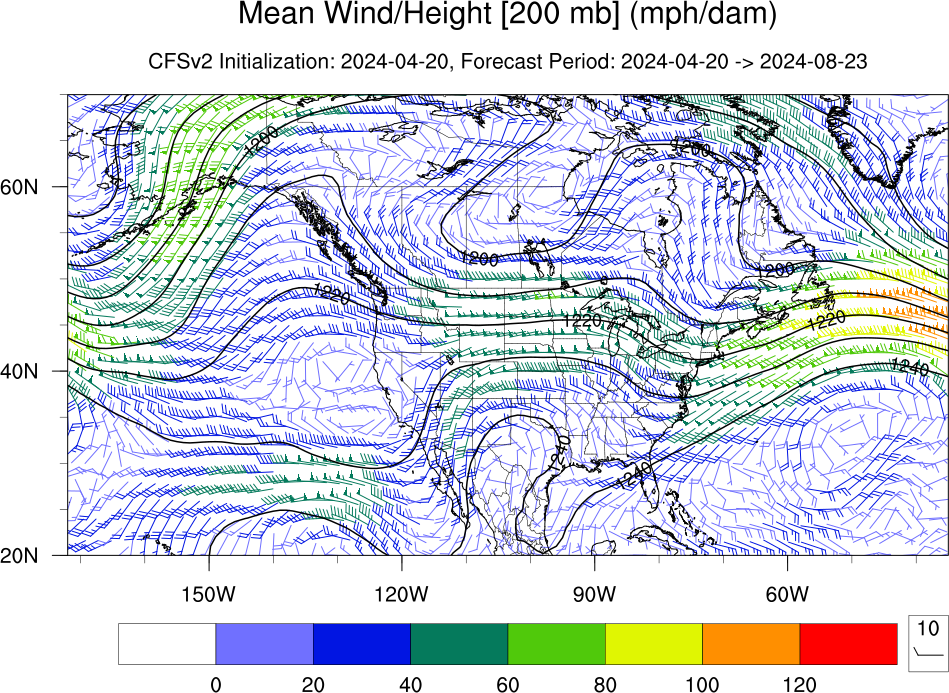
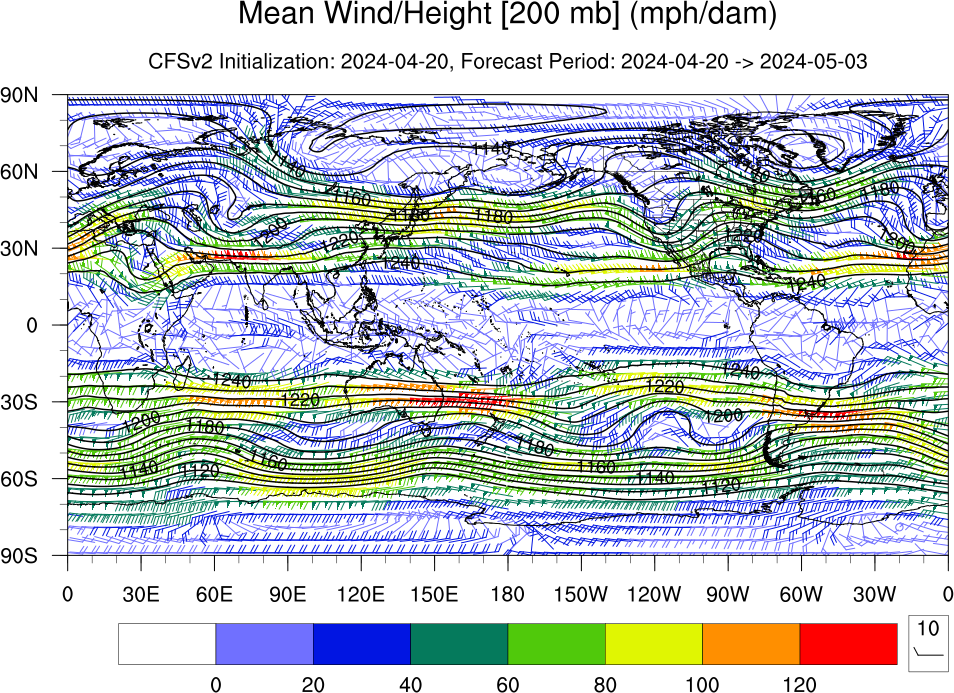
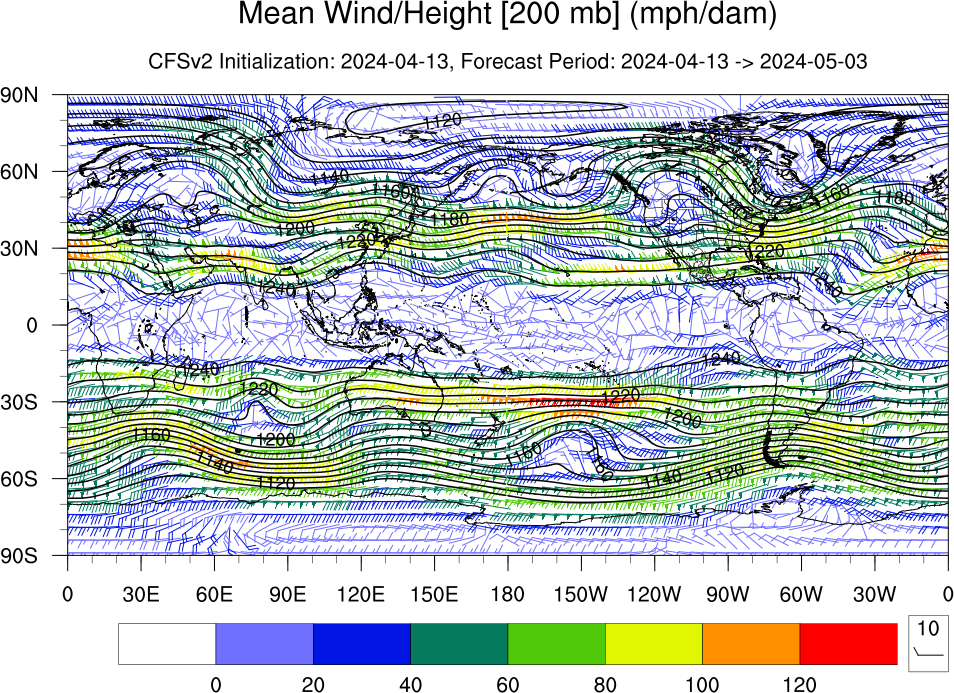
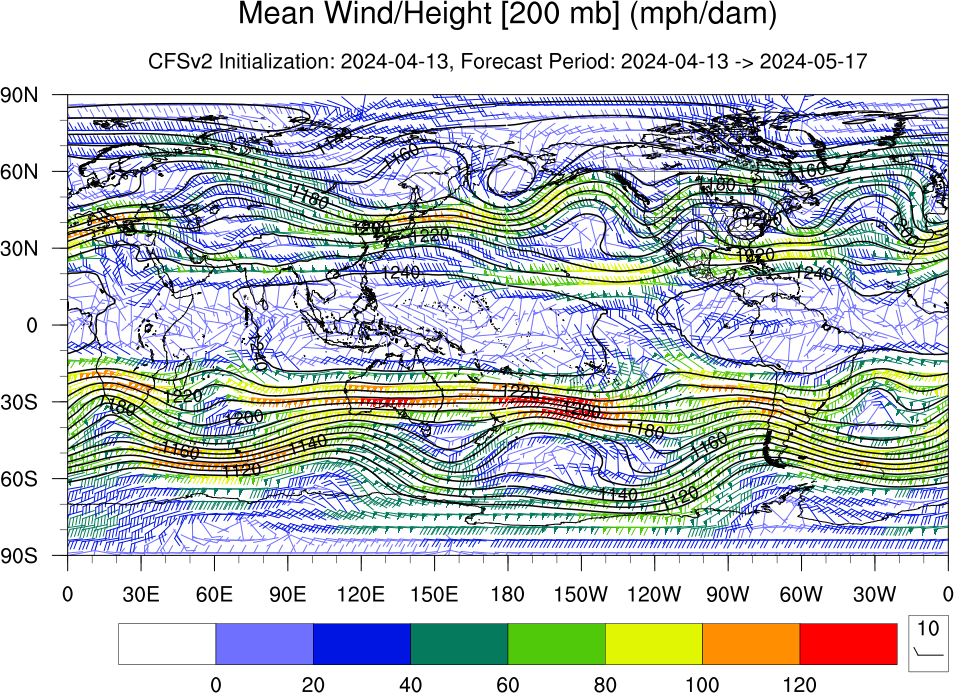
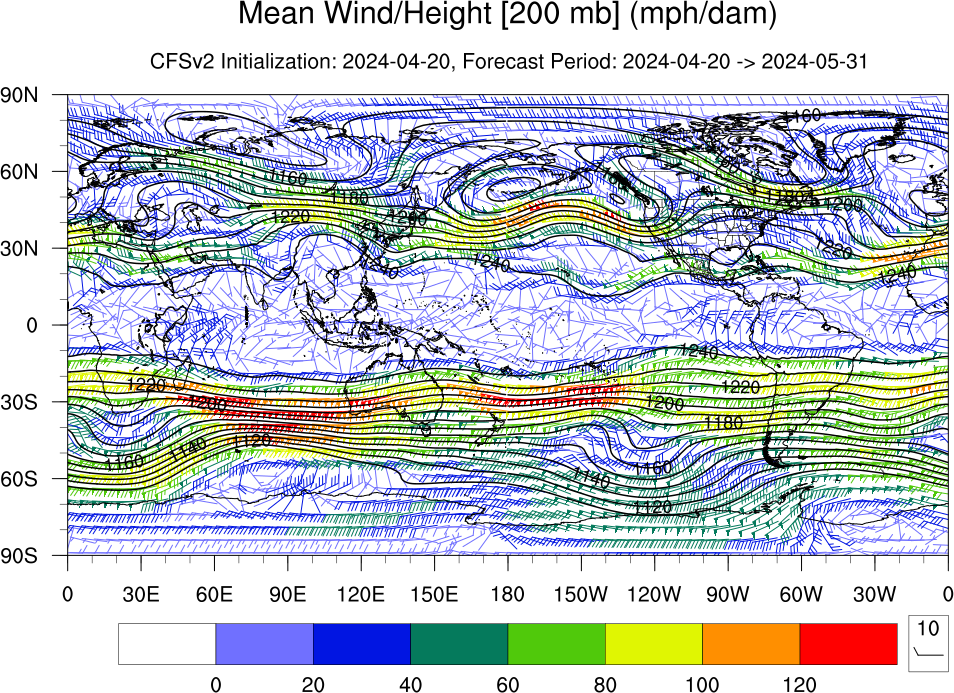
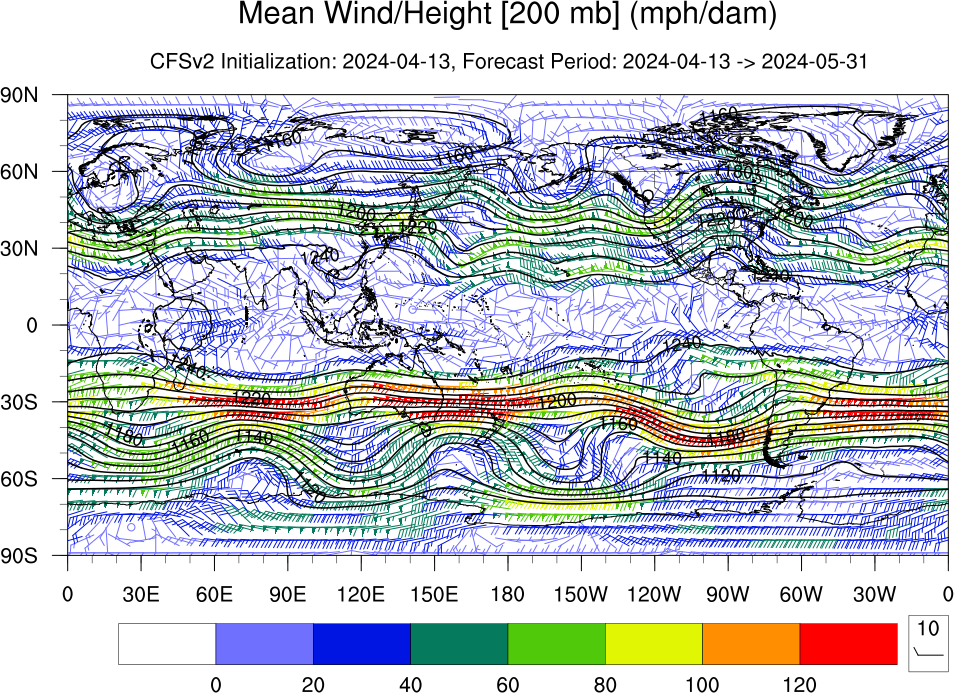
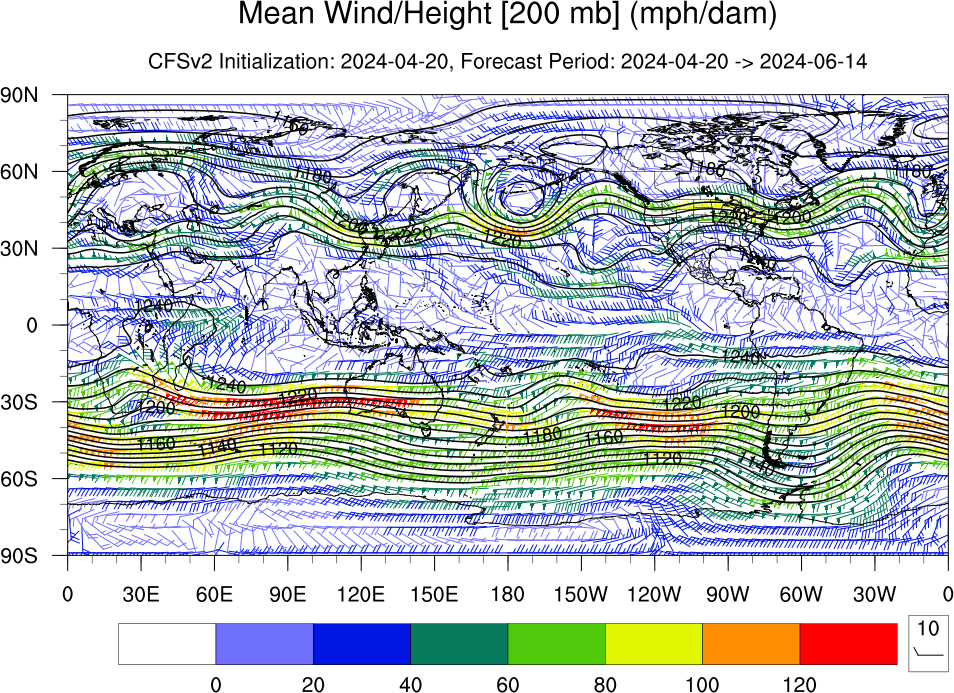
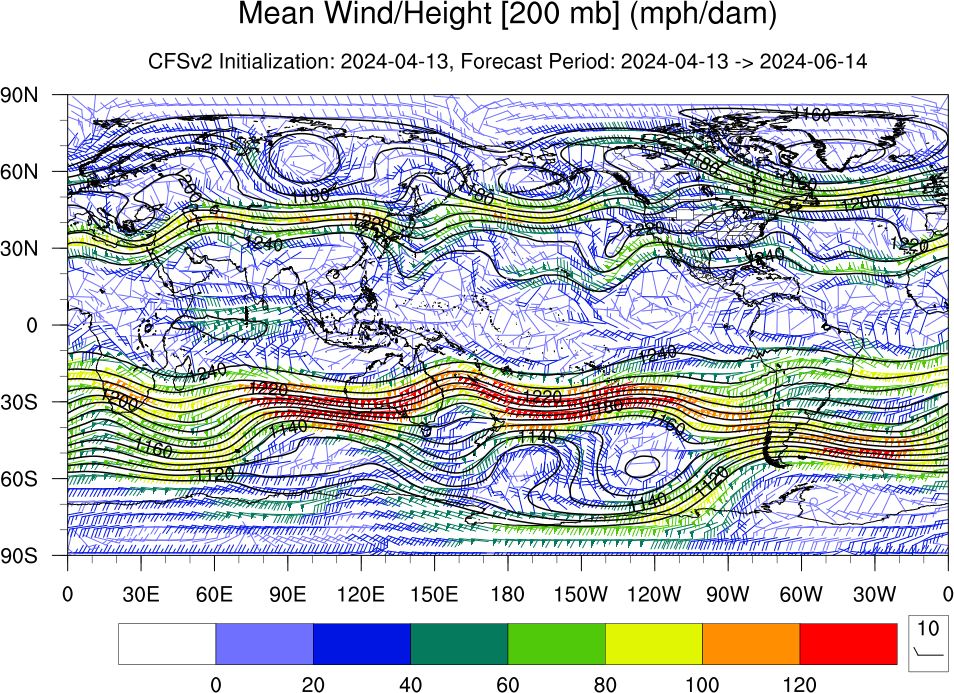
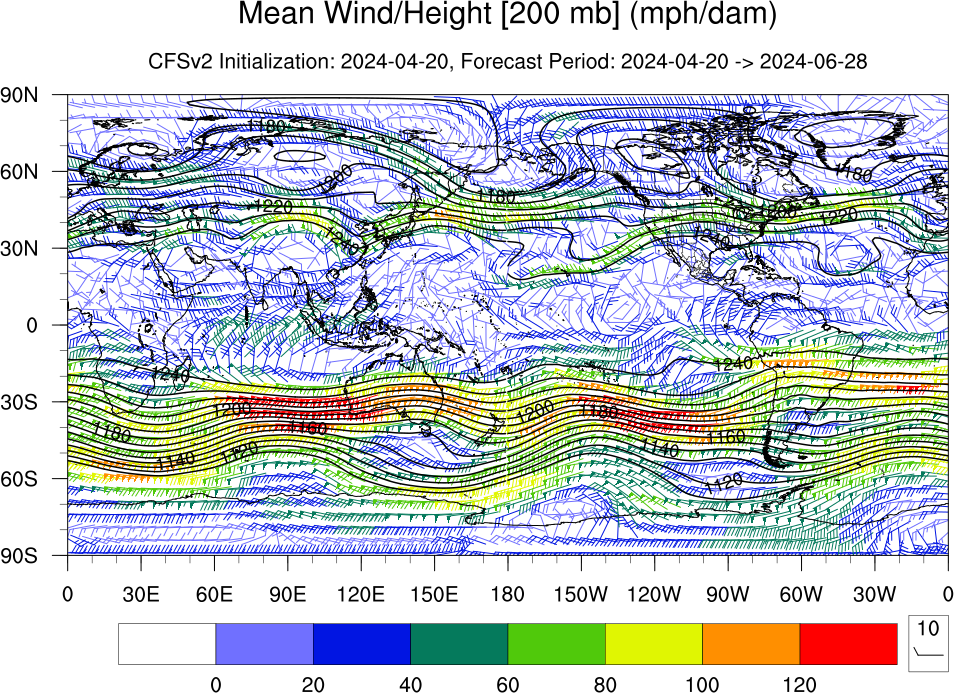
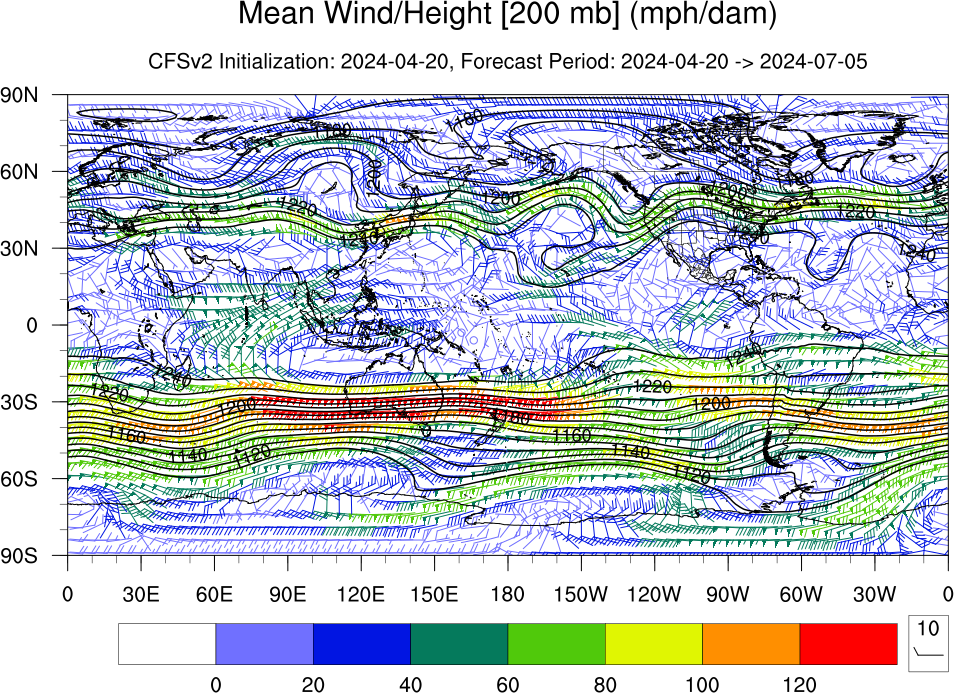
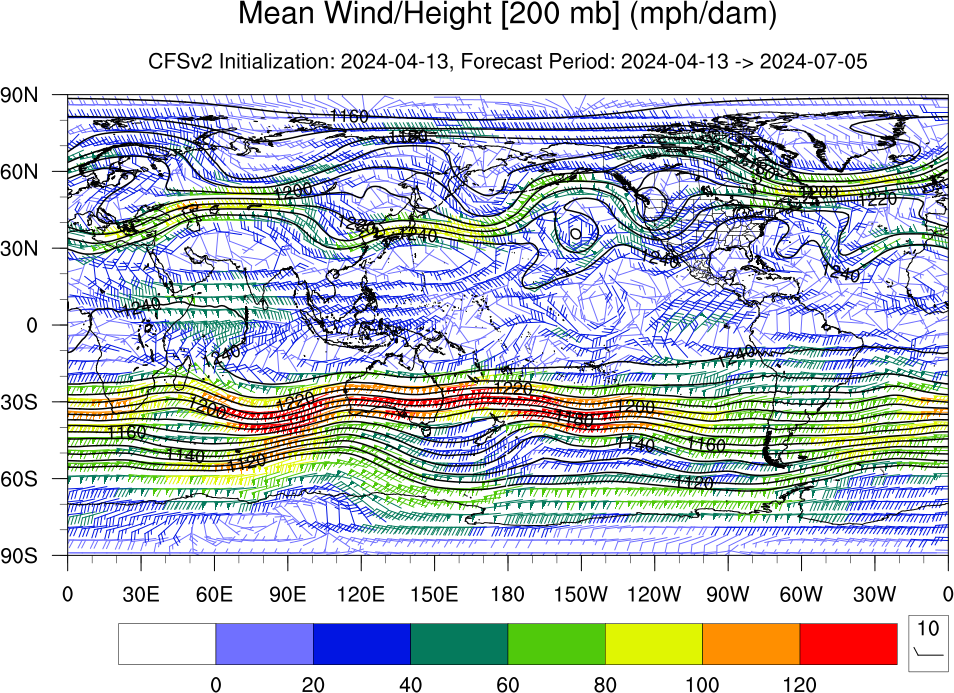
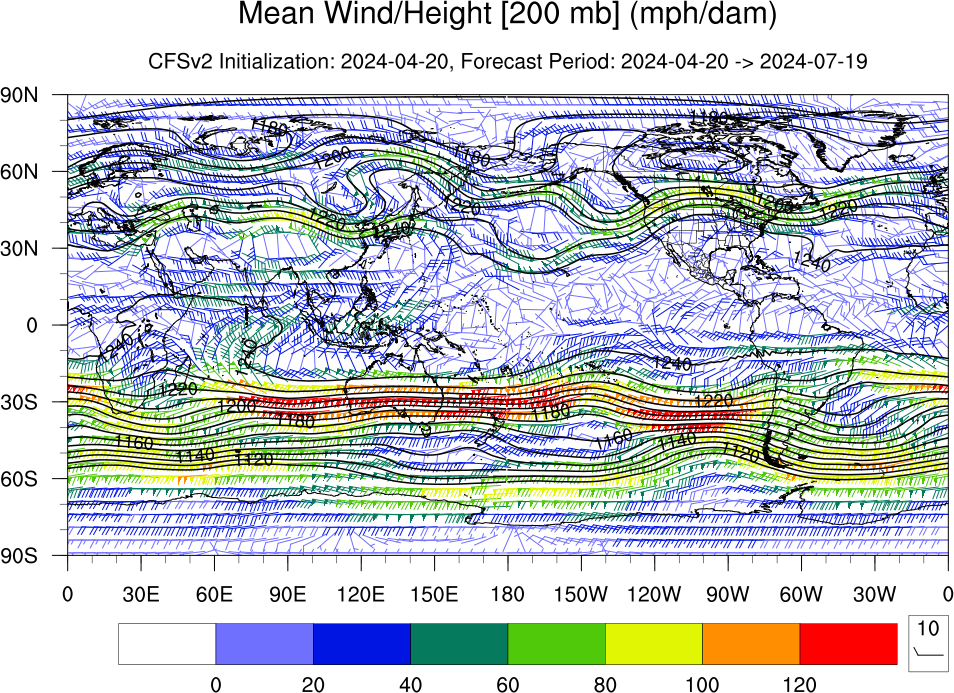
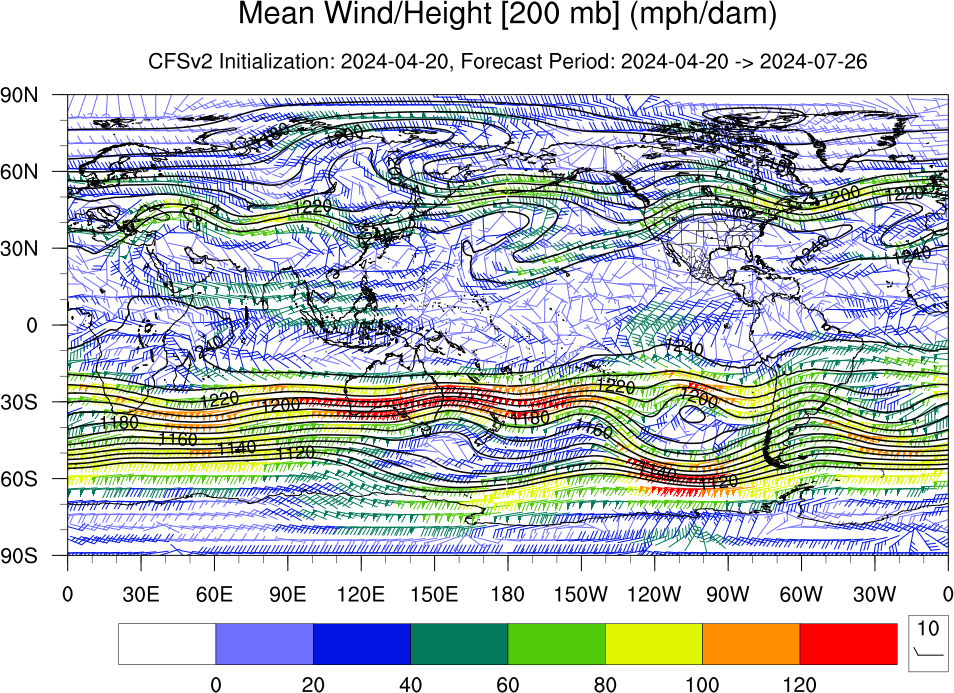
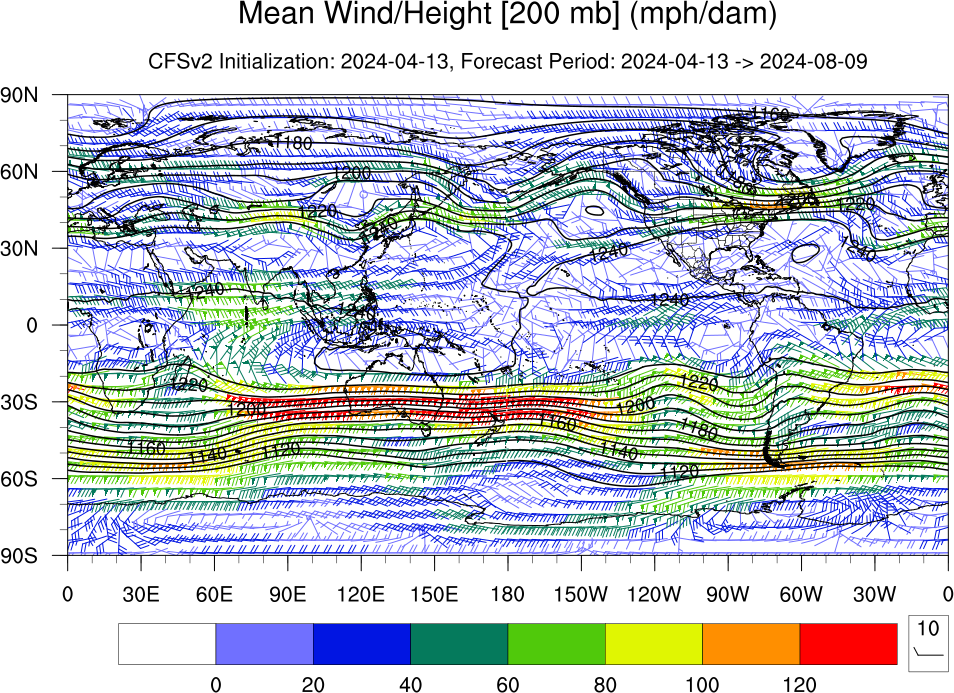
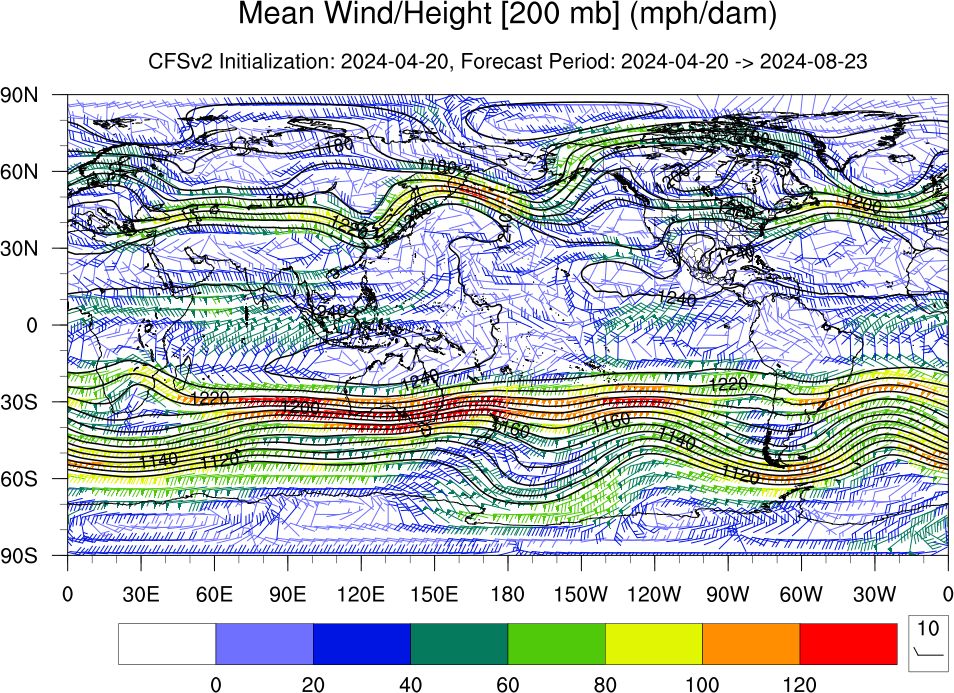
| Mean Wind/Height [200 mb] (mph/dam) | Loop | Grid | 18Jul | 25Jul | 01Aug | 08Aug | 15Aug | 22Aug | 29Aug | 05Sep | 12Sep |
| 19Sep | 26Sep | 03Oct | 10Oct | 17Oct | 24Oct | 31Oct | 07Nov | 14Nov | |||
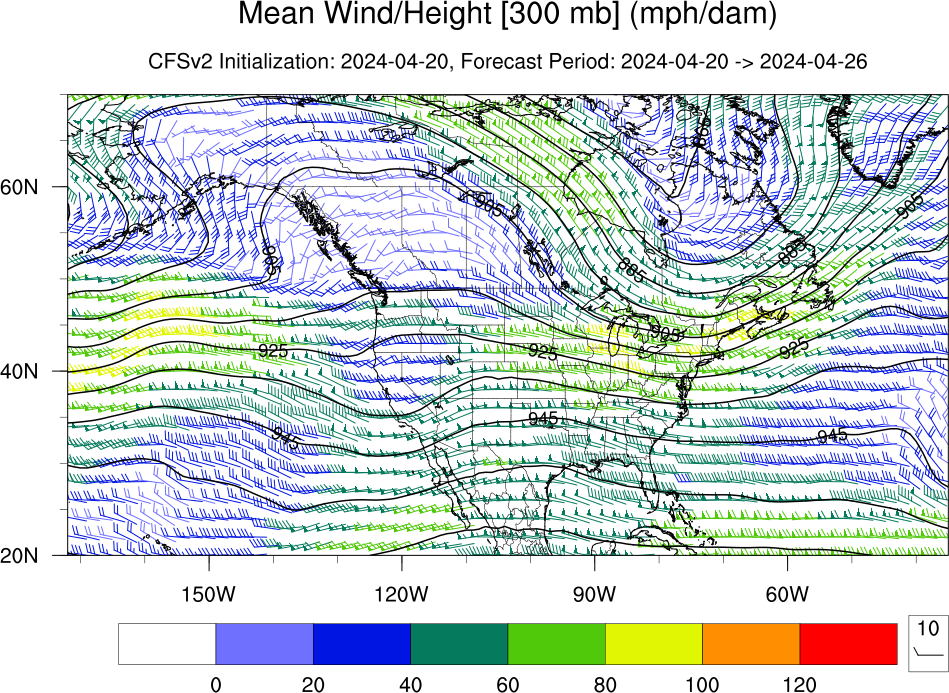
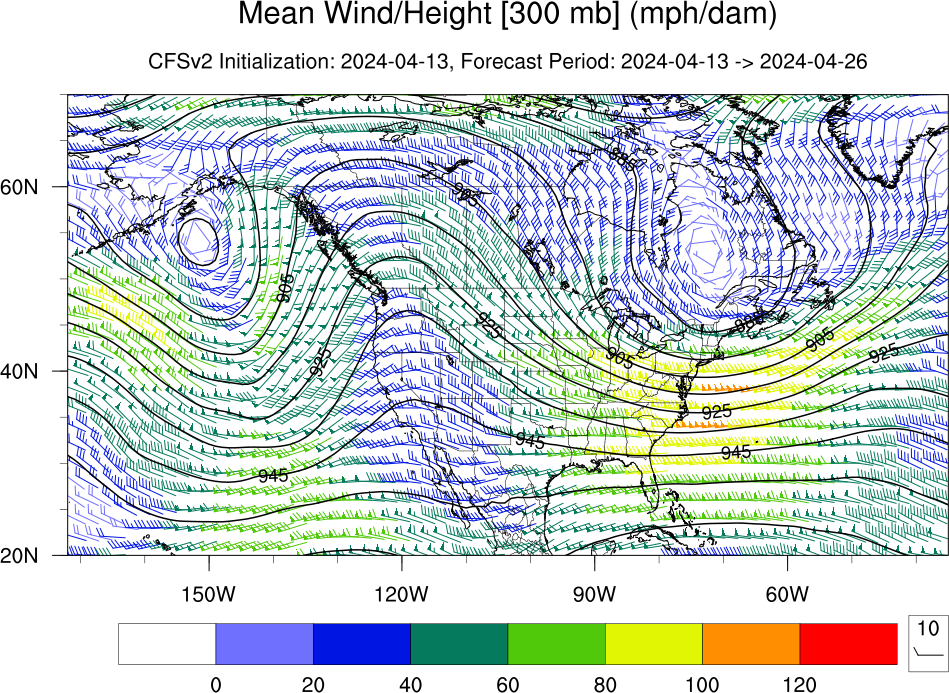
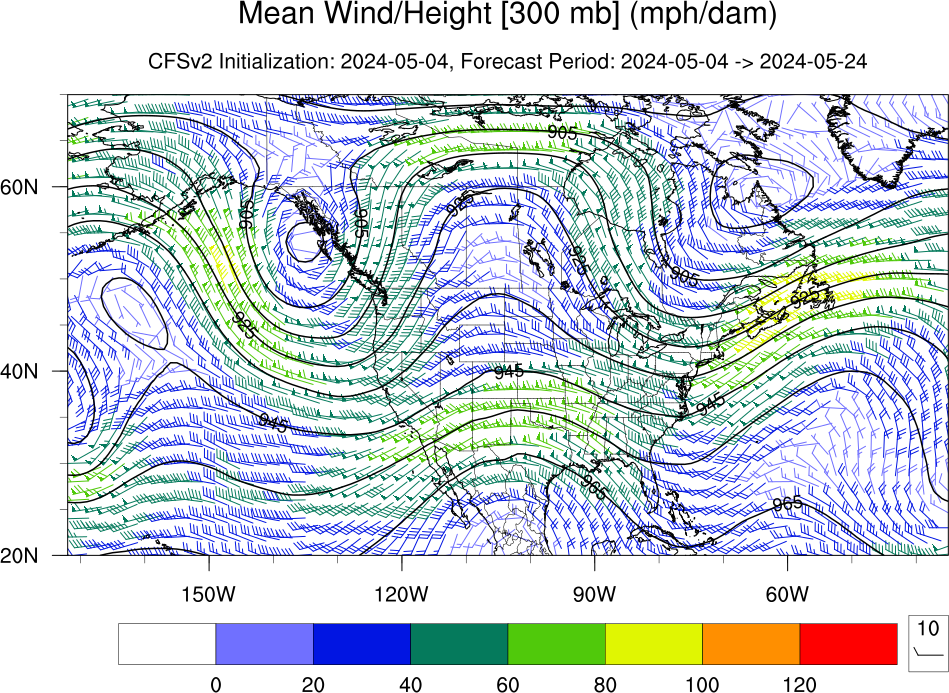
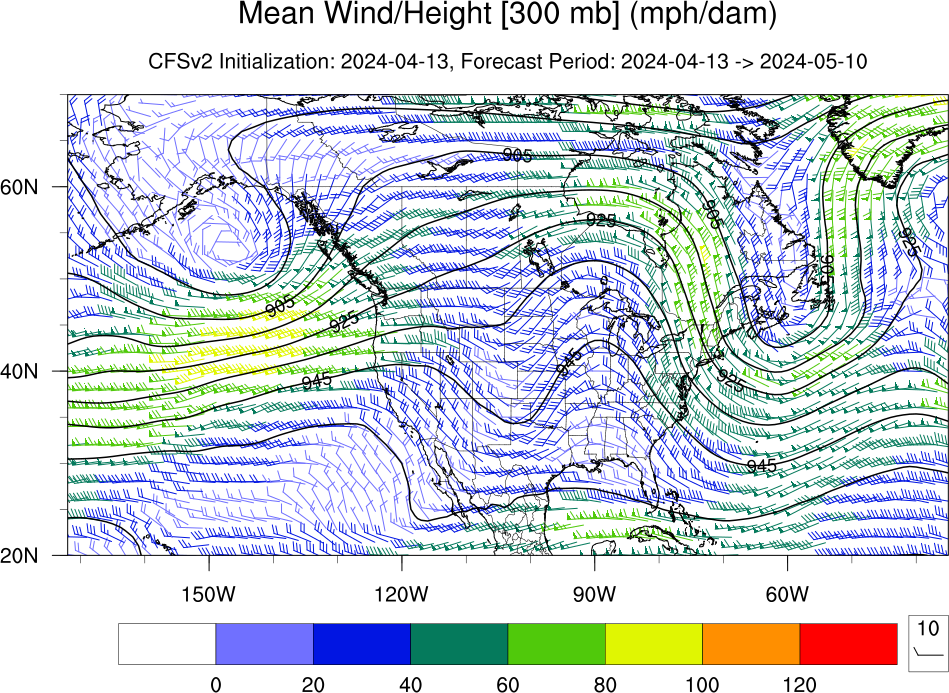
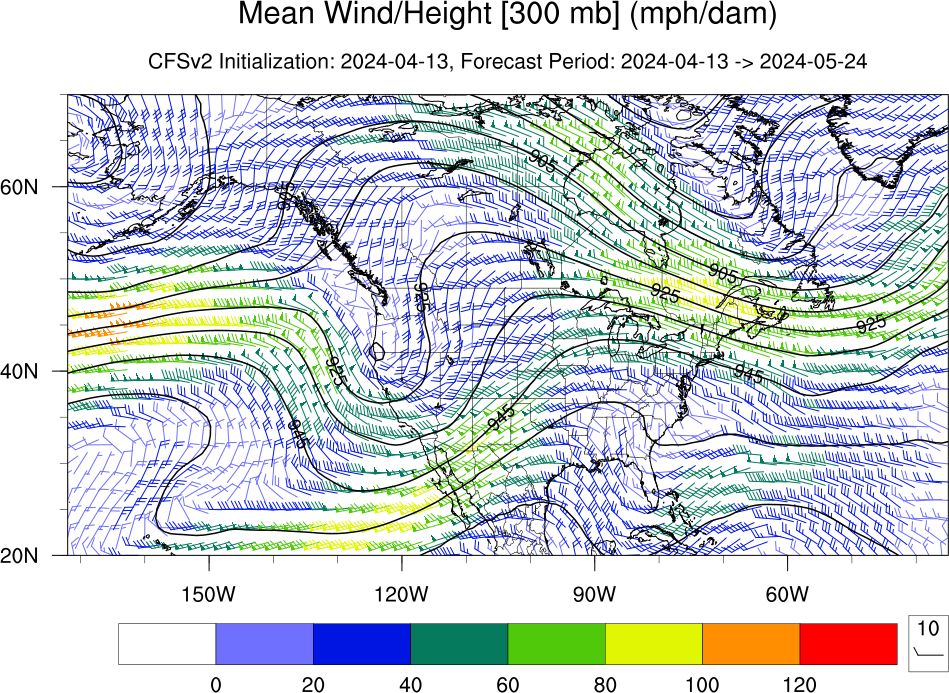
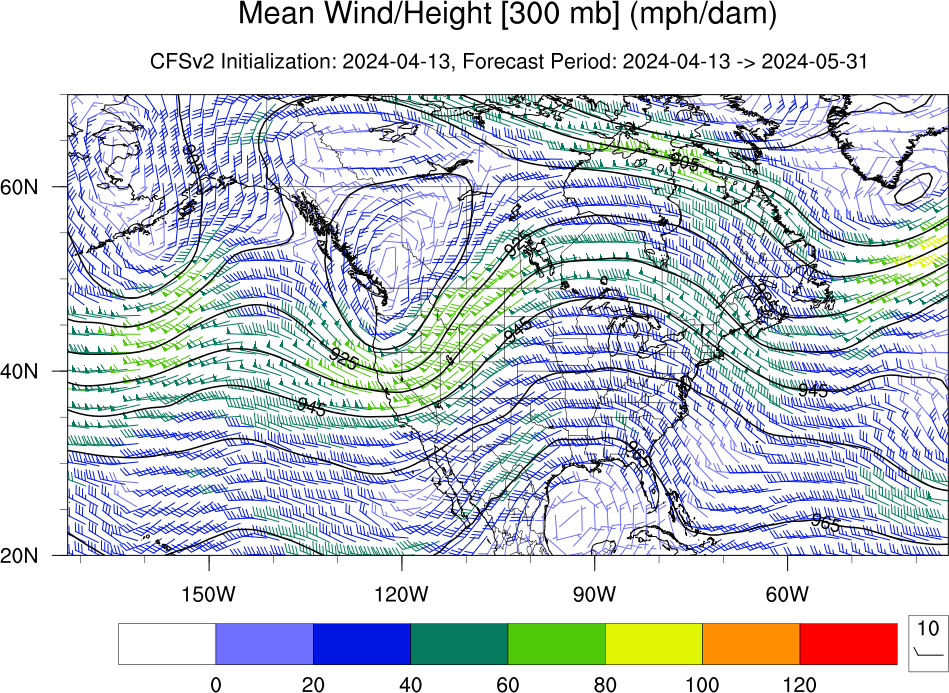
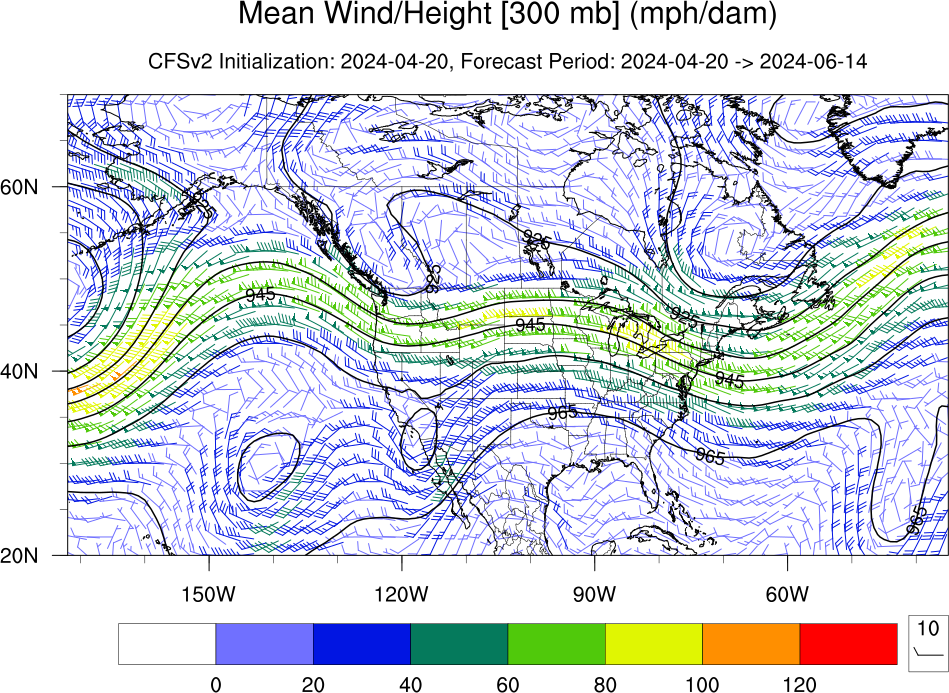
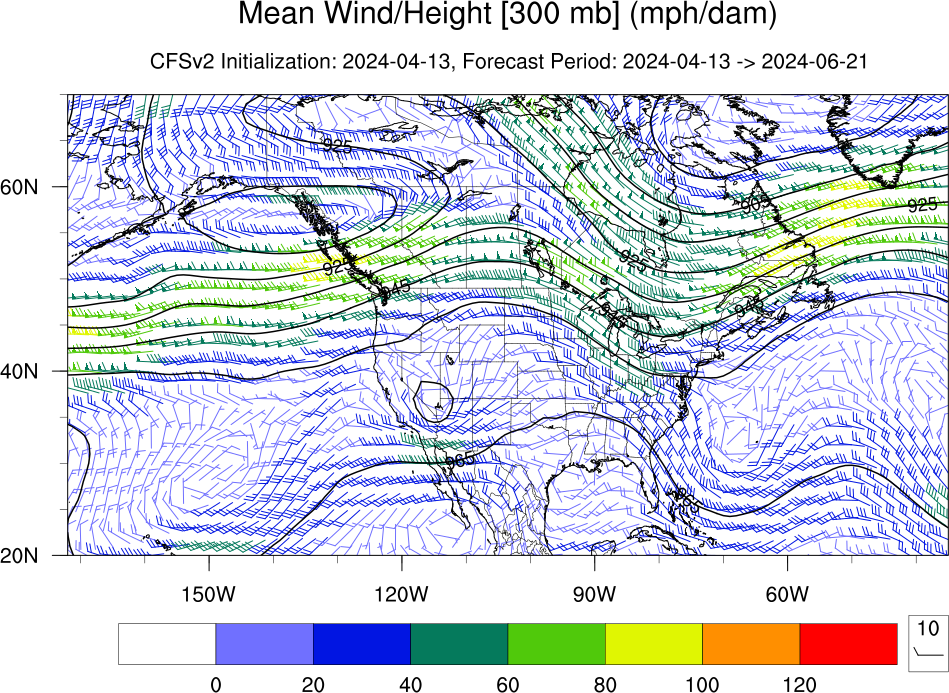
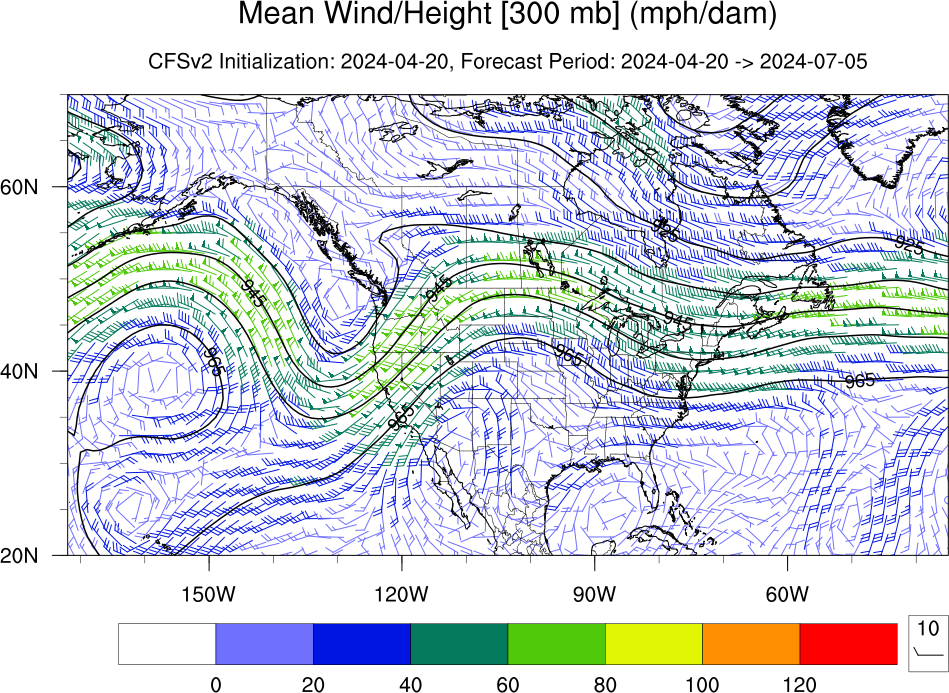
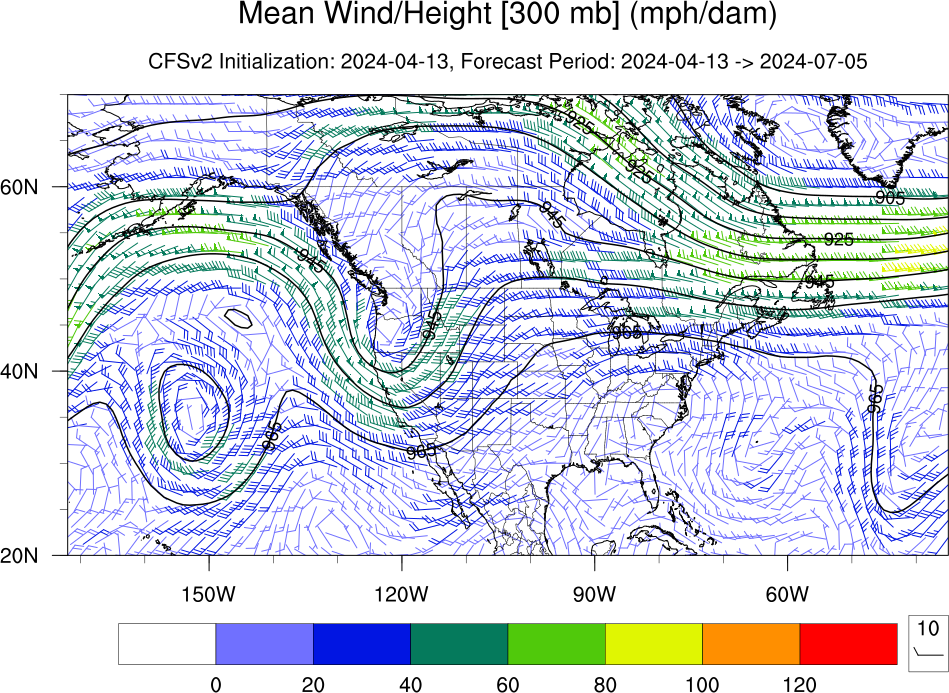
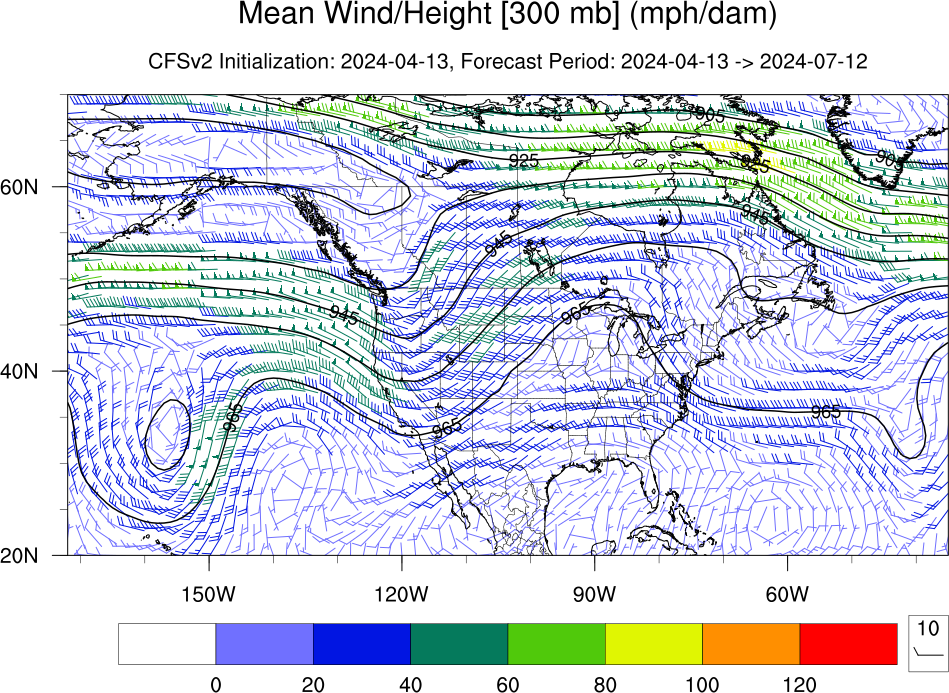
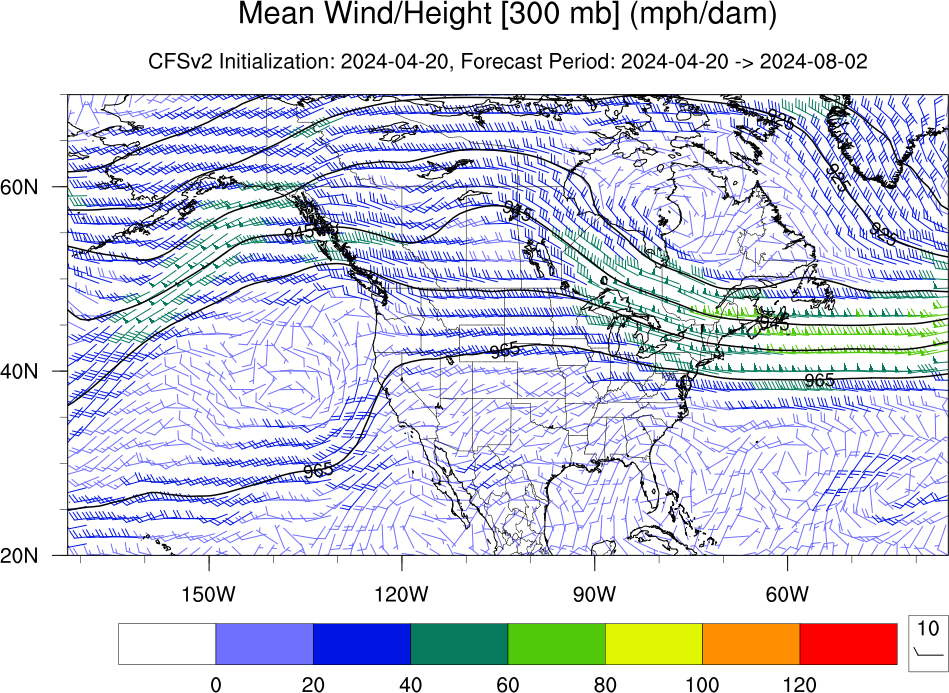
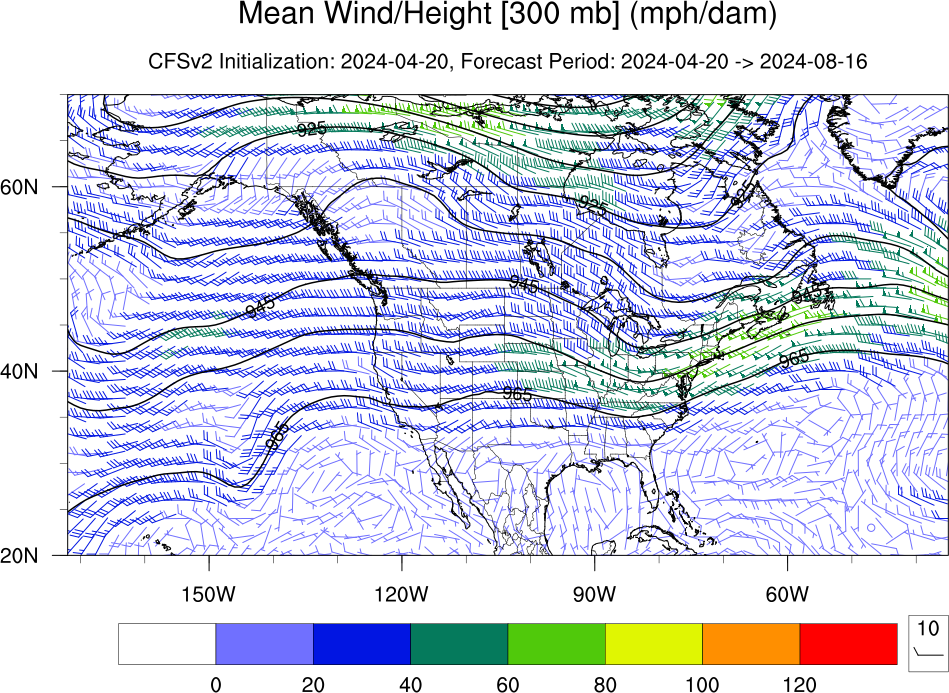
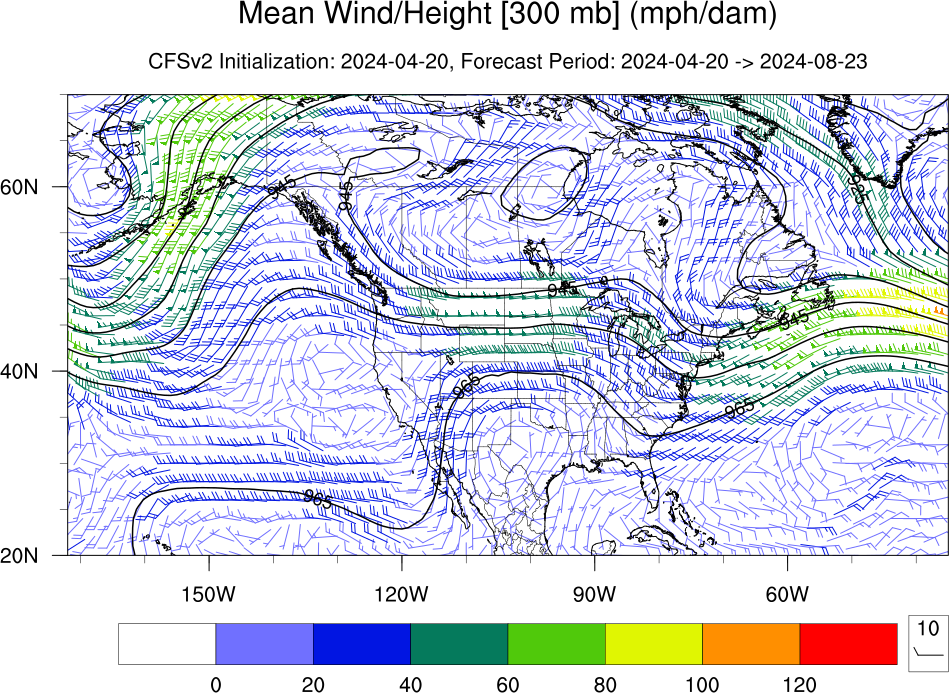
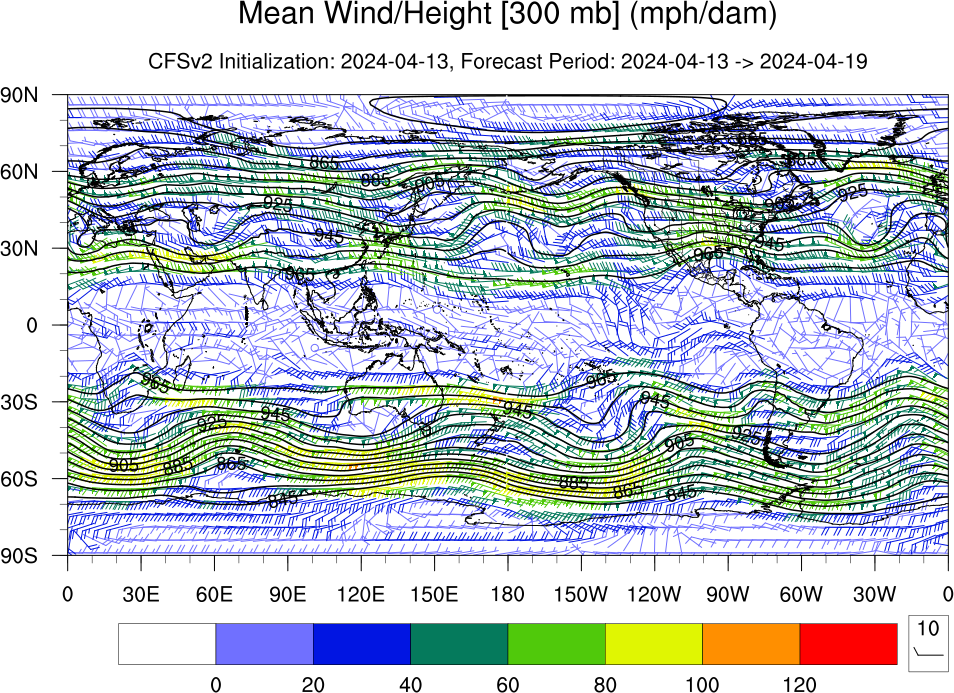
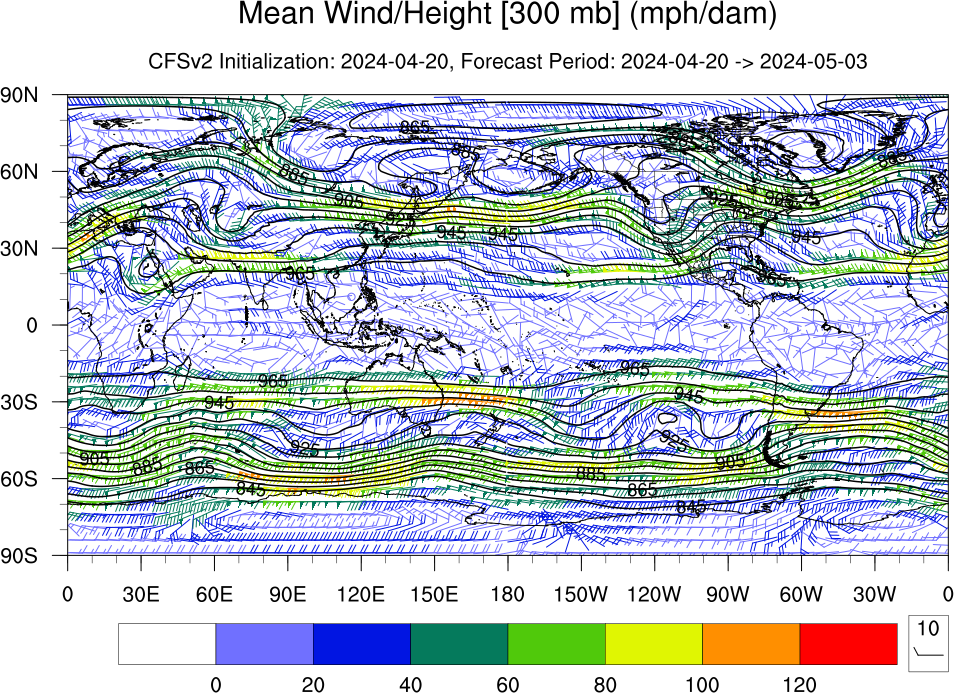
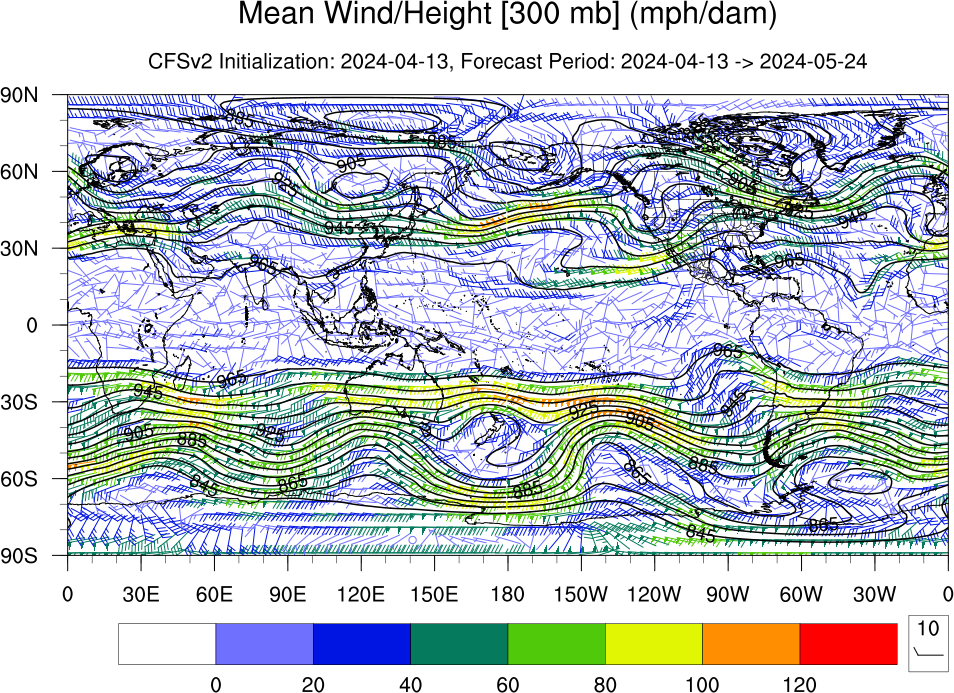
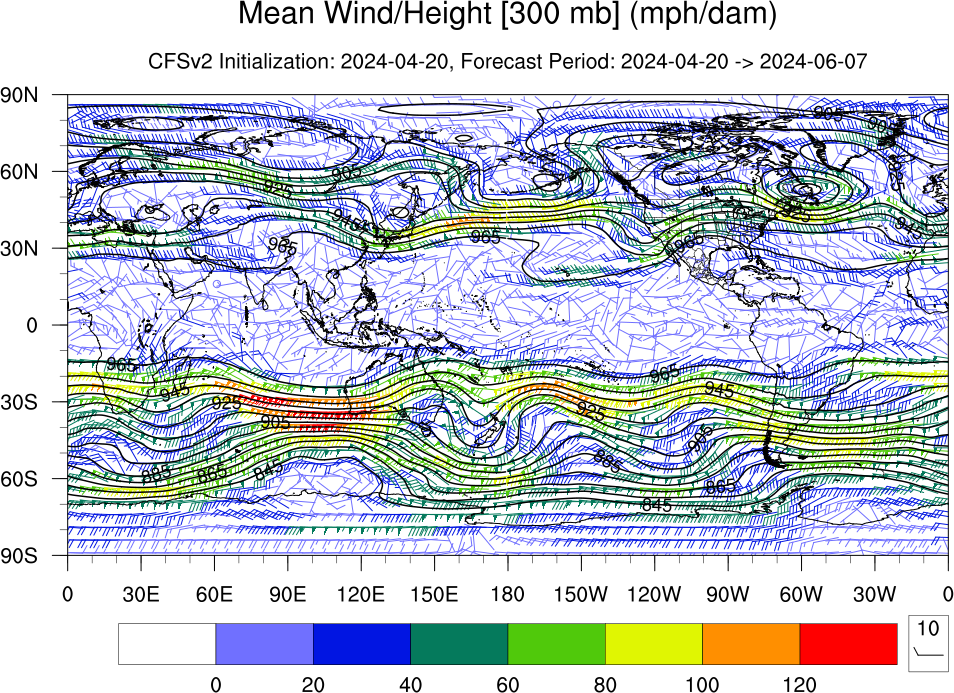
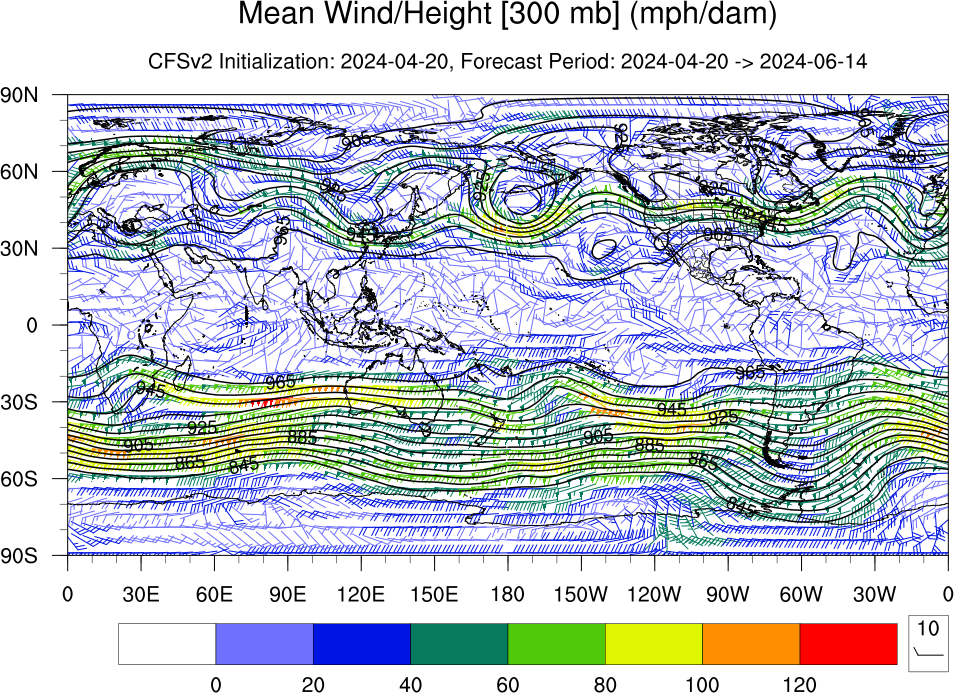
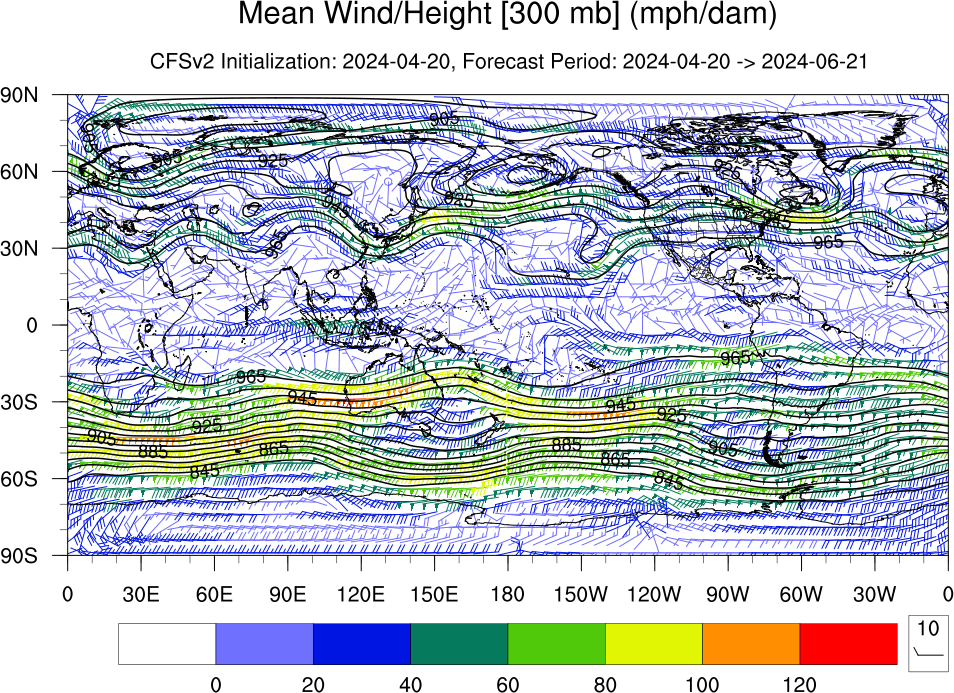
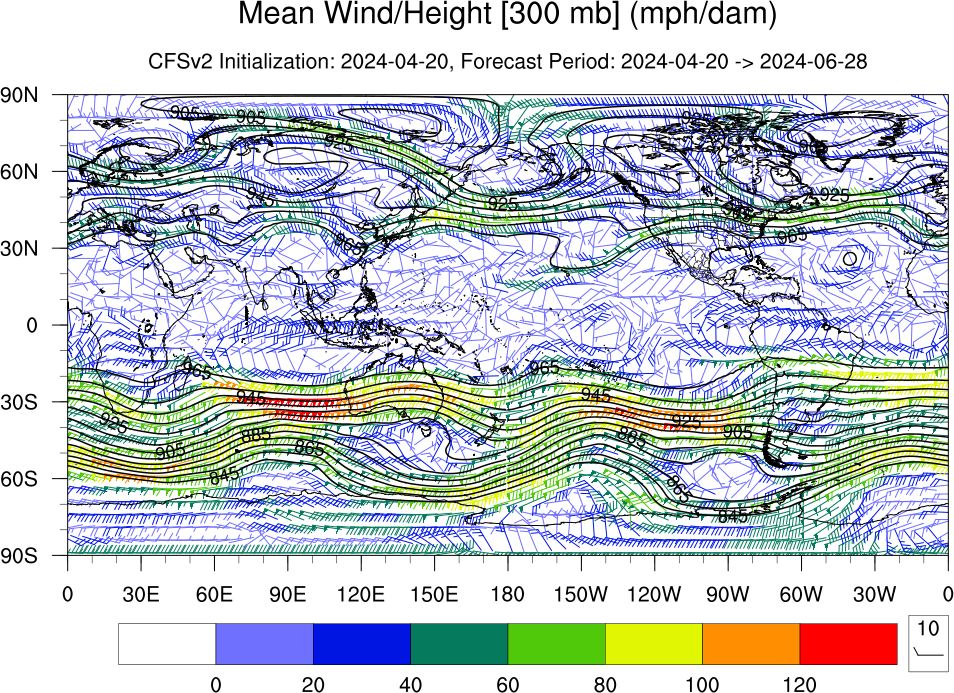
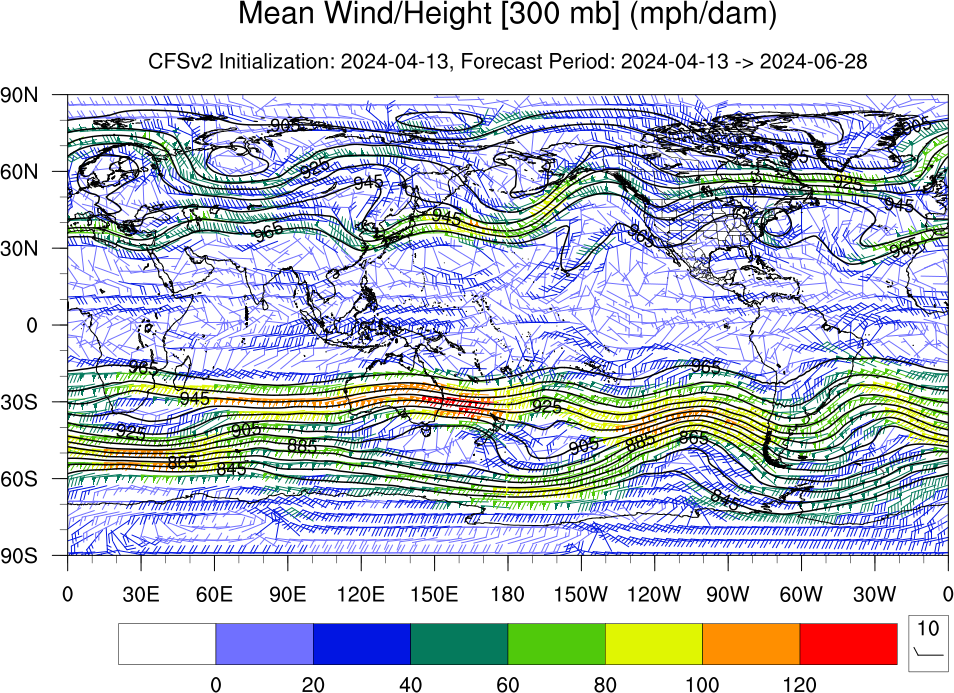
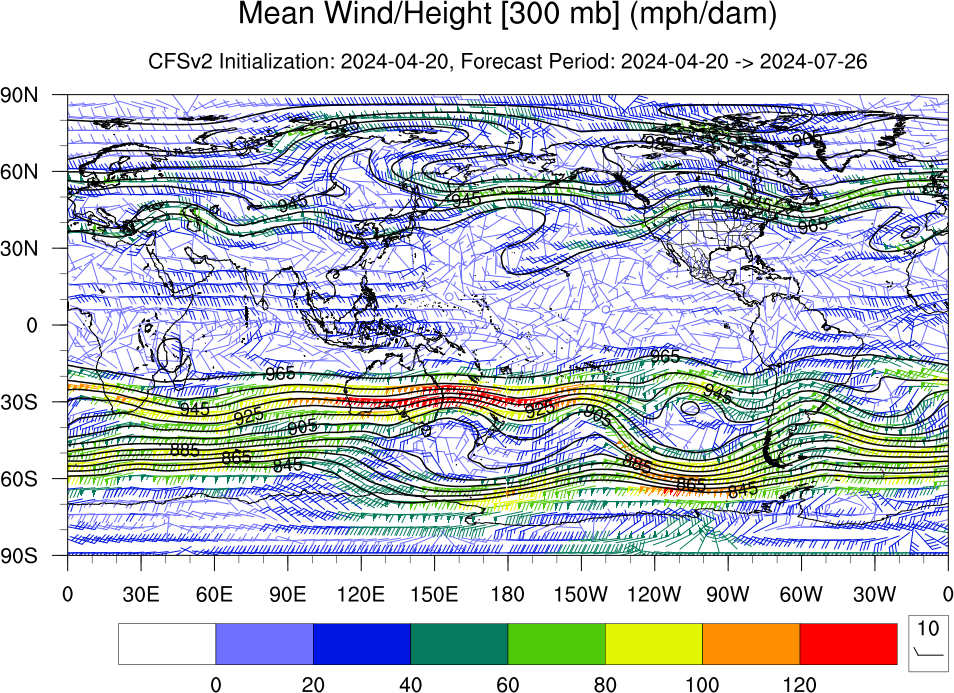
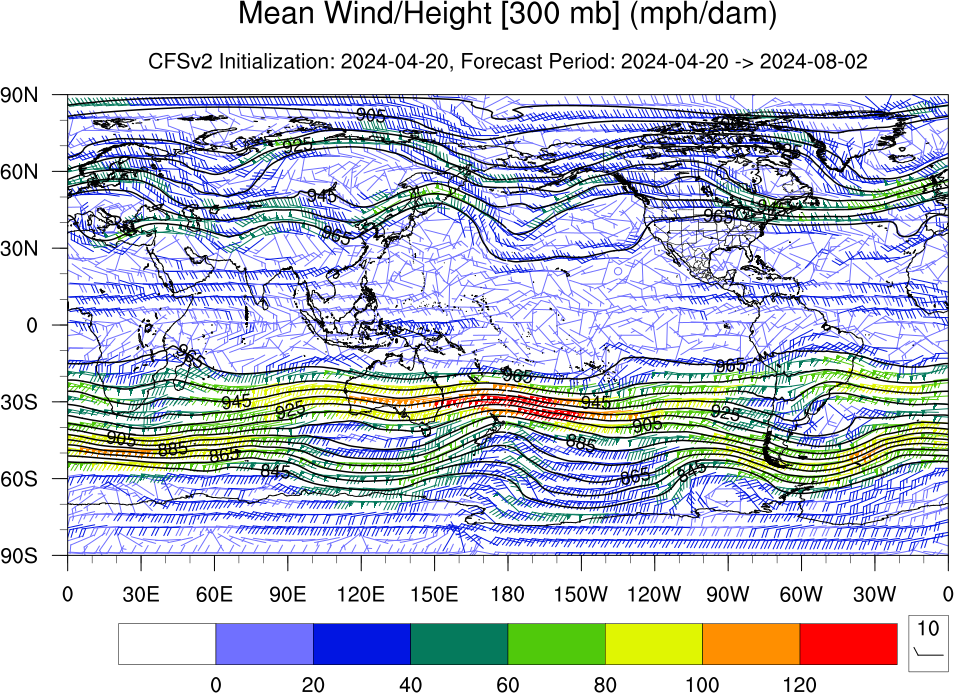
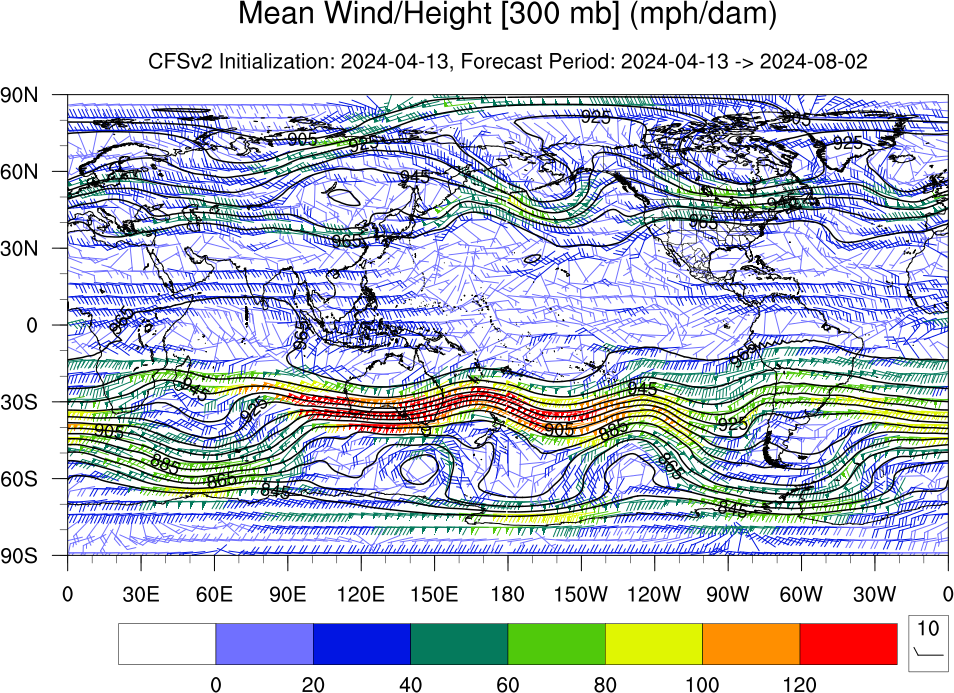
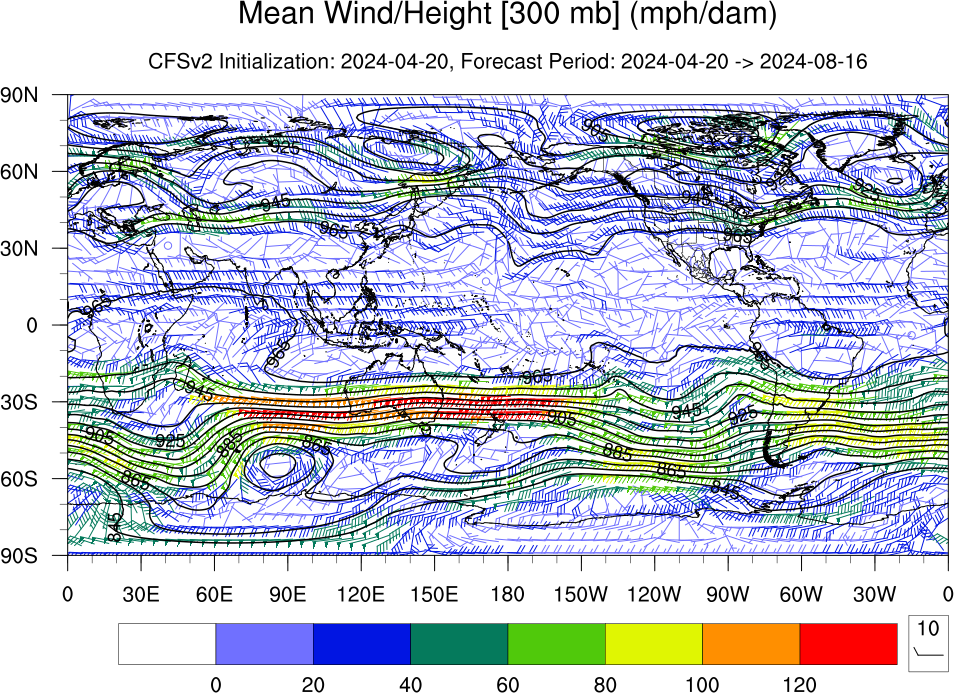
| Mean Wind/Height [300 mb] (mph/dam) | Loop | Grid | 18Jul | 25Jul | 01Aug | 08Aug | 15Aug | 22Aug | 29Aug | 05Sep | 12Sep |
| 19Sep | 26Sep | 03Oct | 10Oct | 17Oct | 24Oct | 31Oct | 07Nov | 14Nov | |||
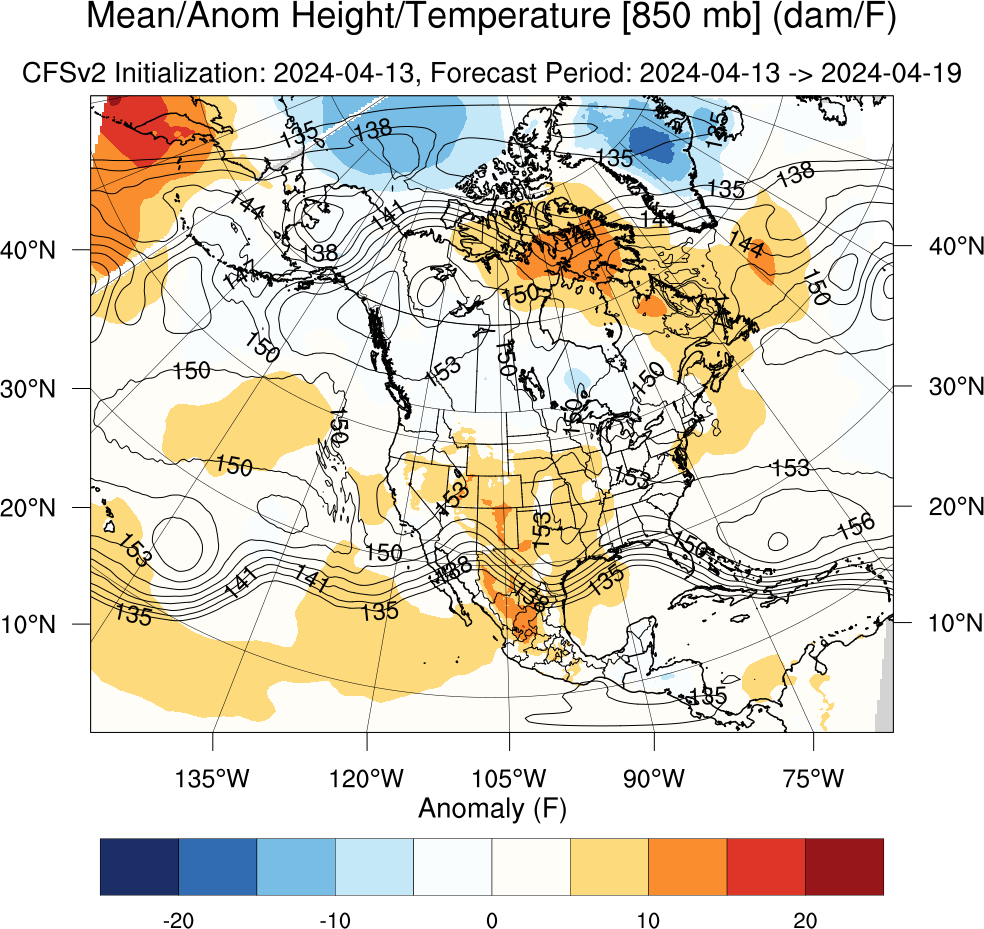
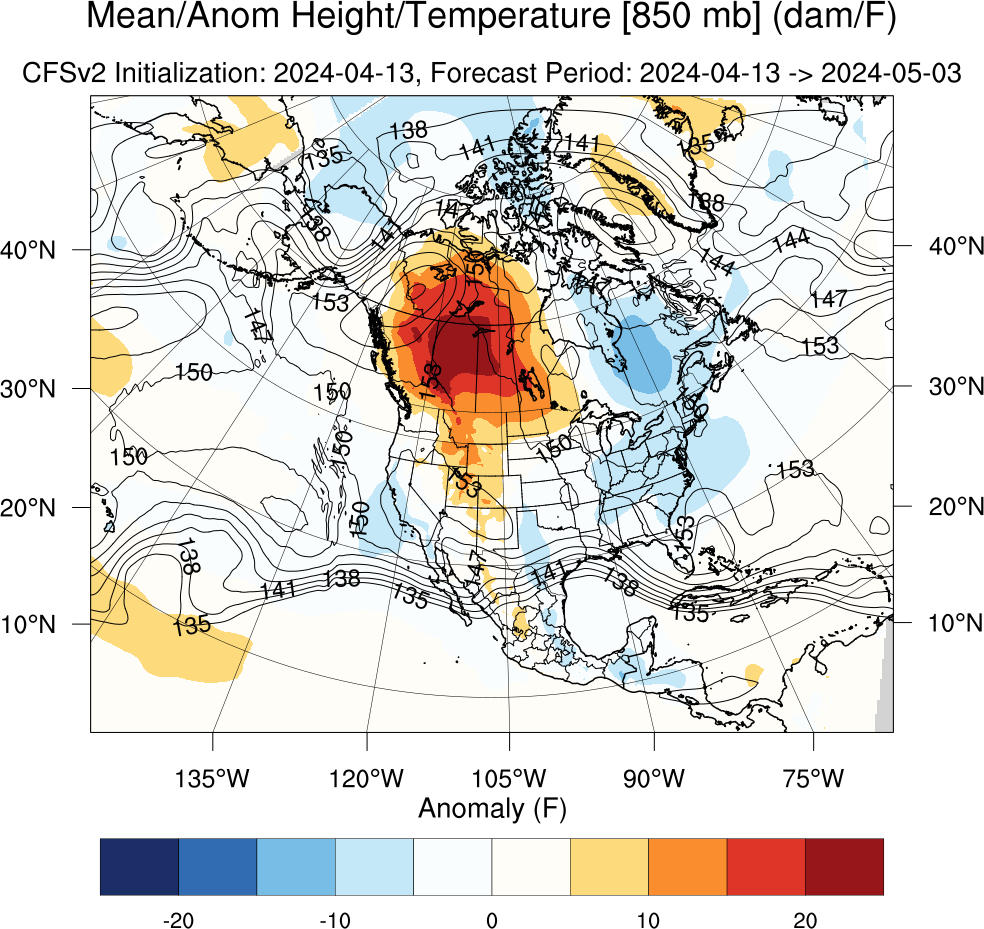
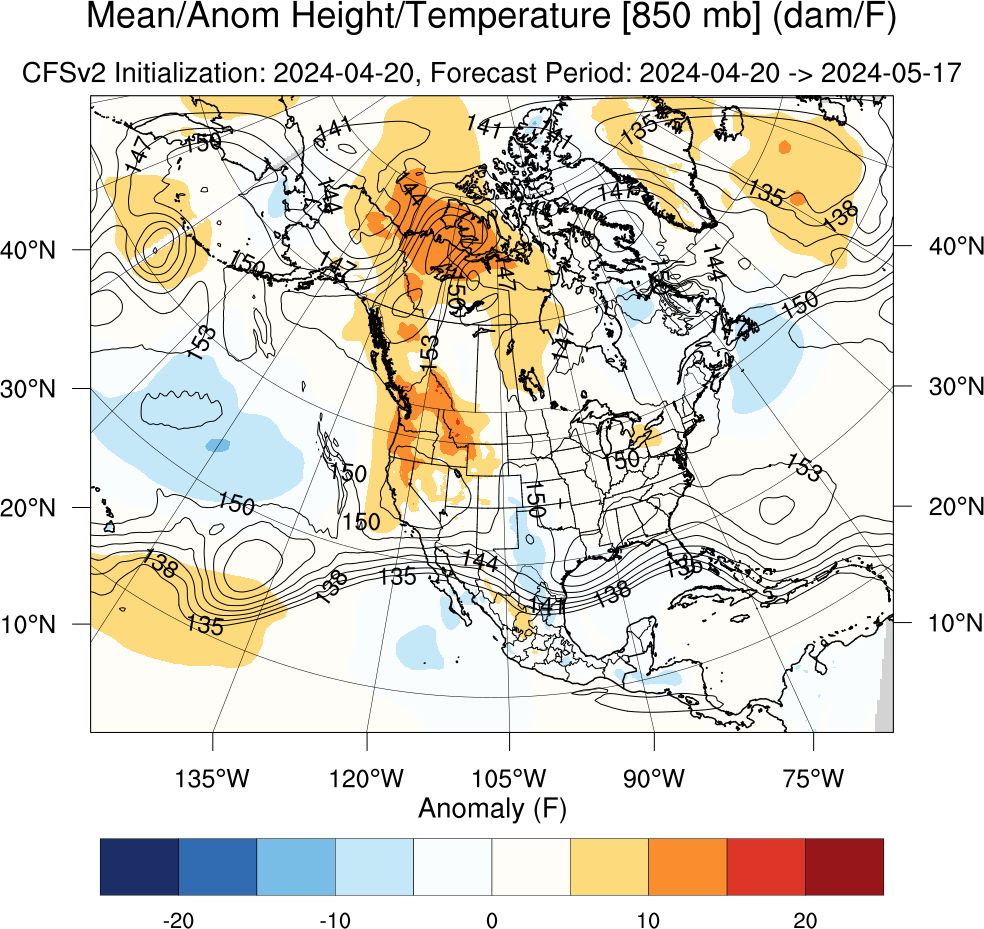
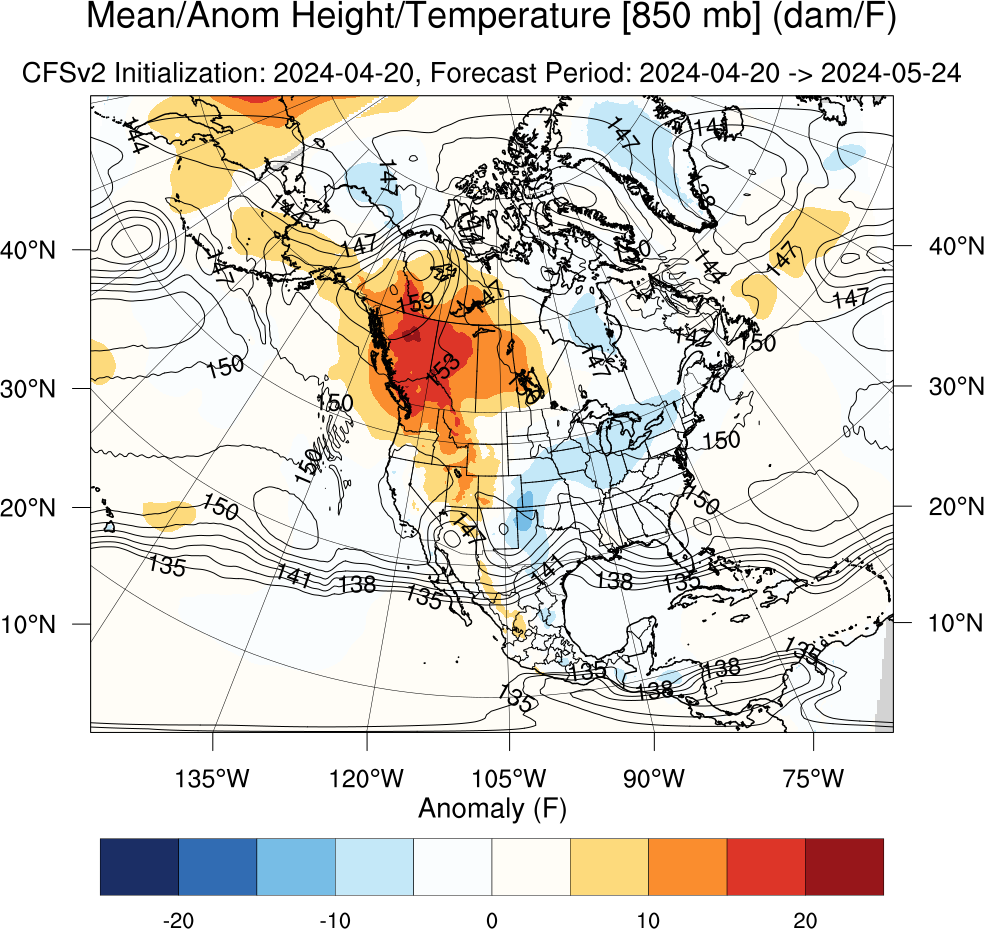
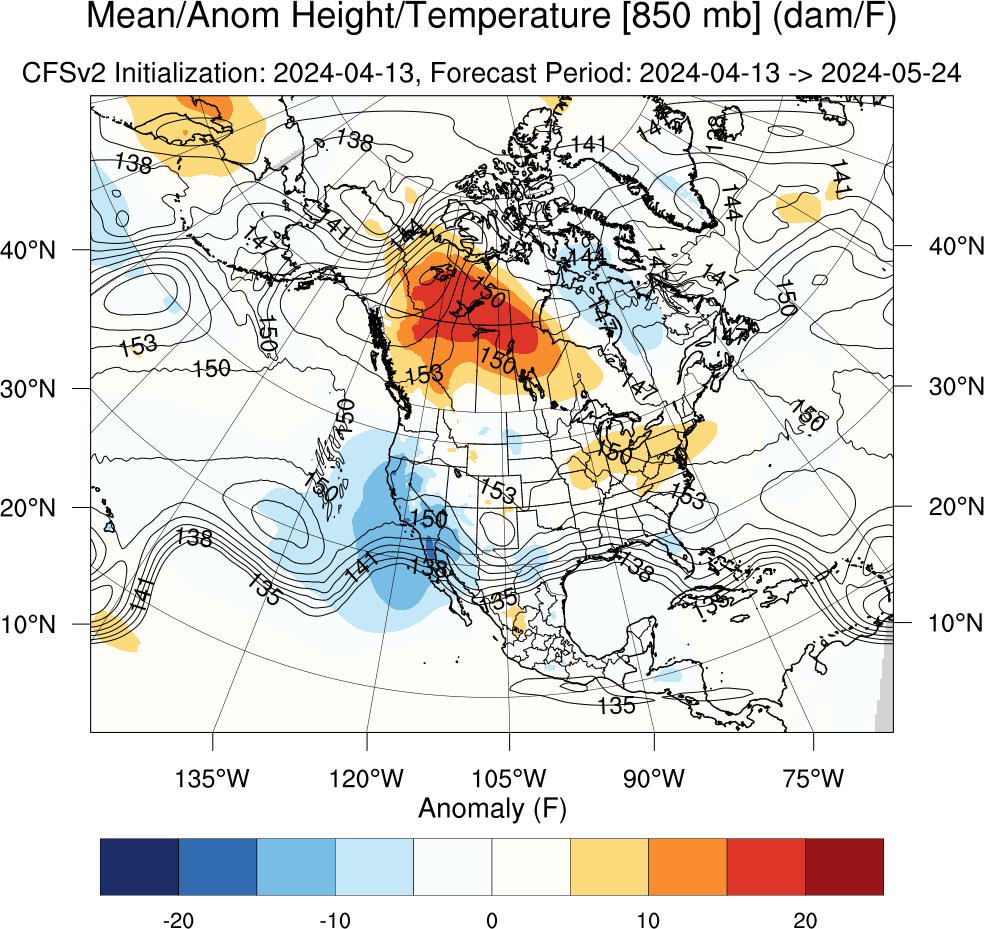
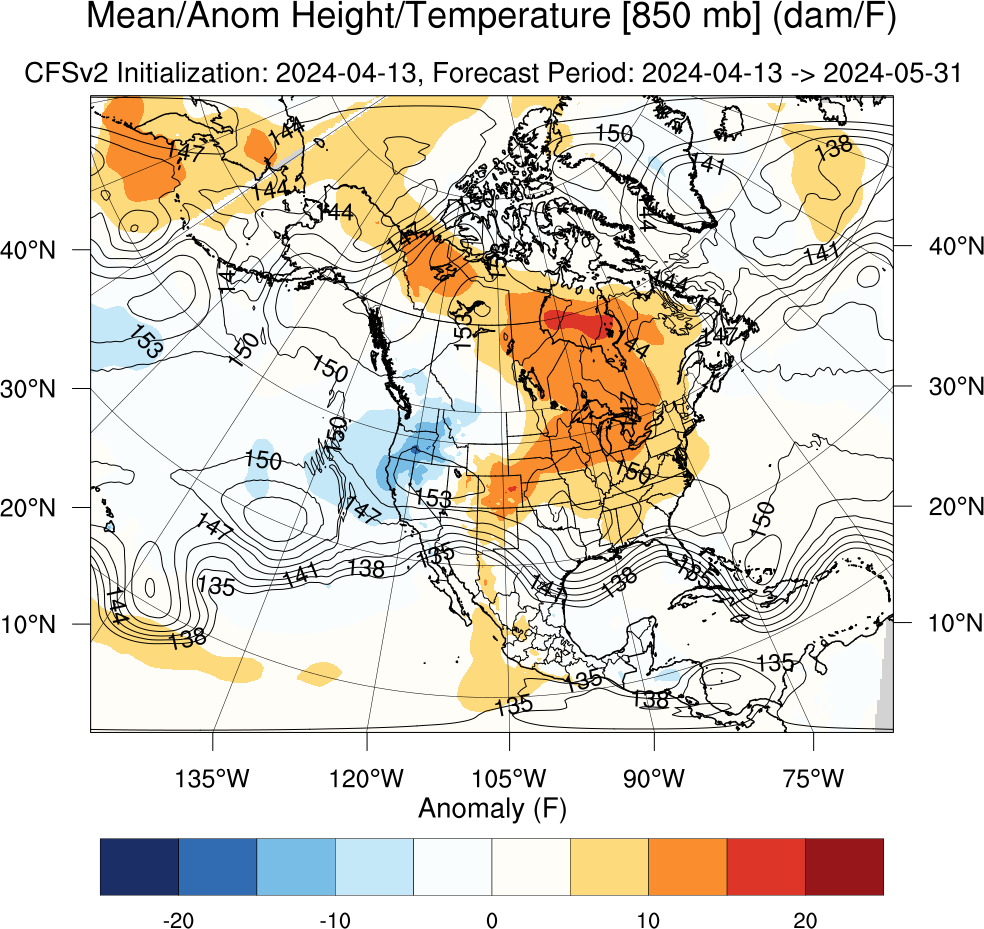
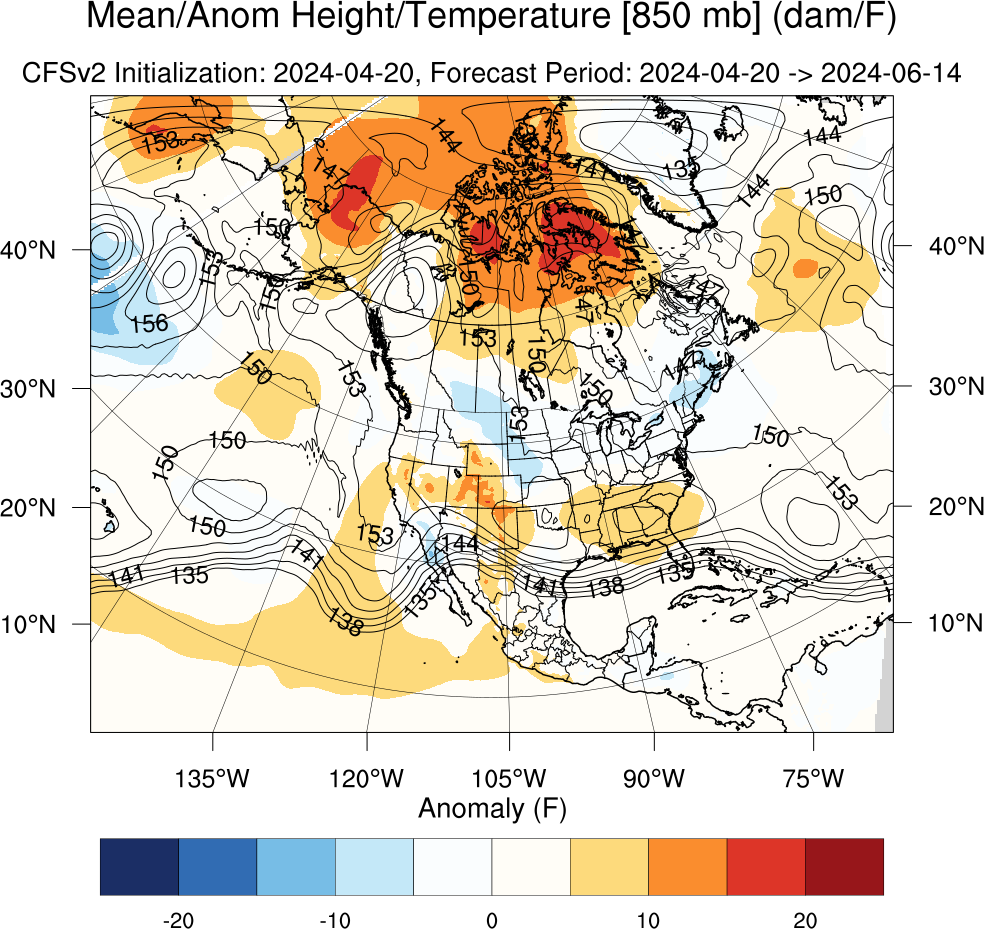
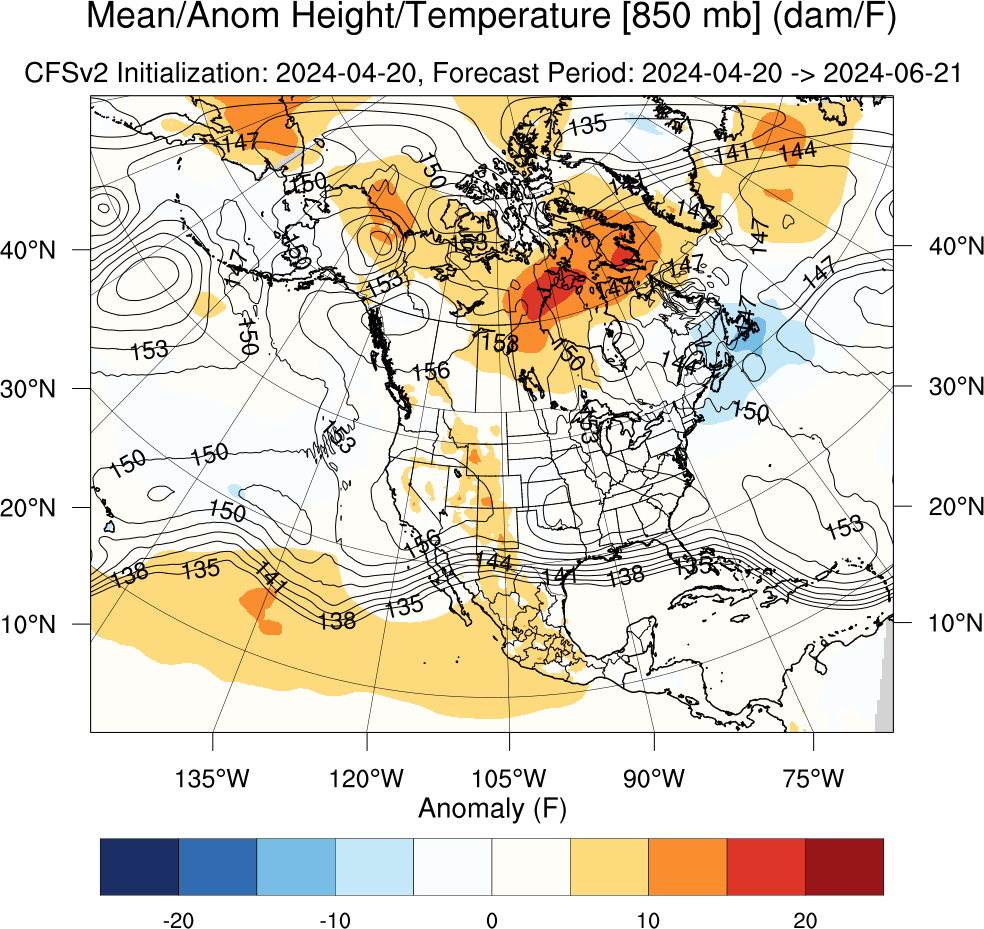
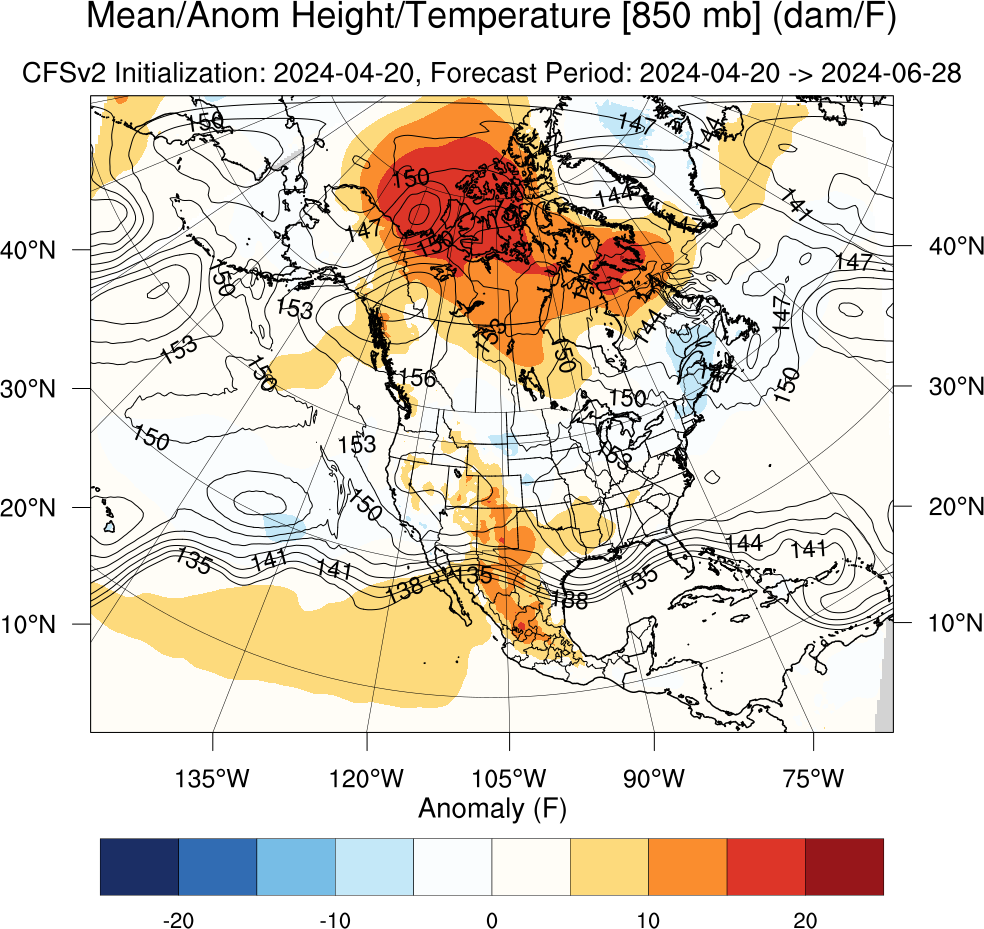
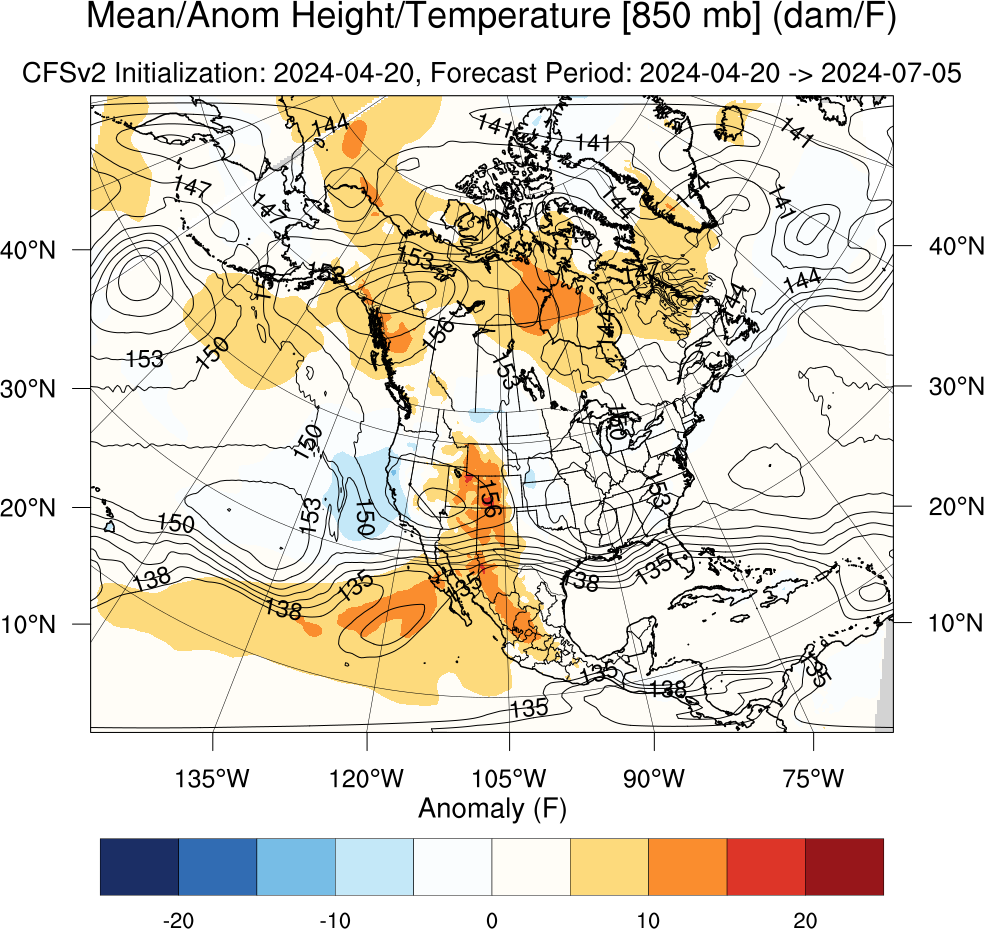
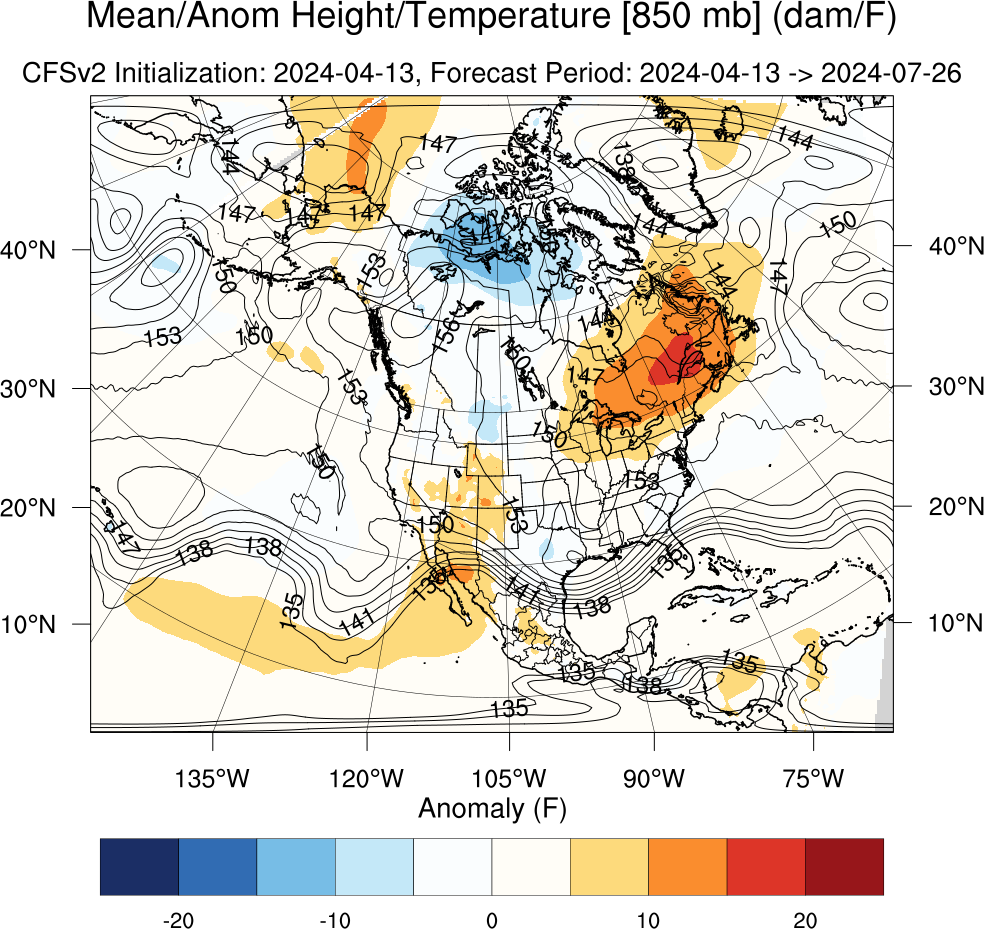
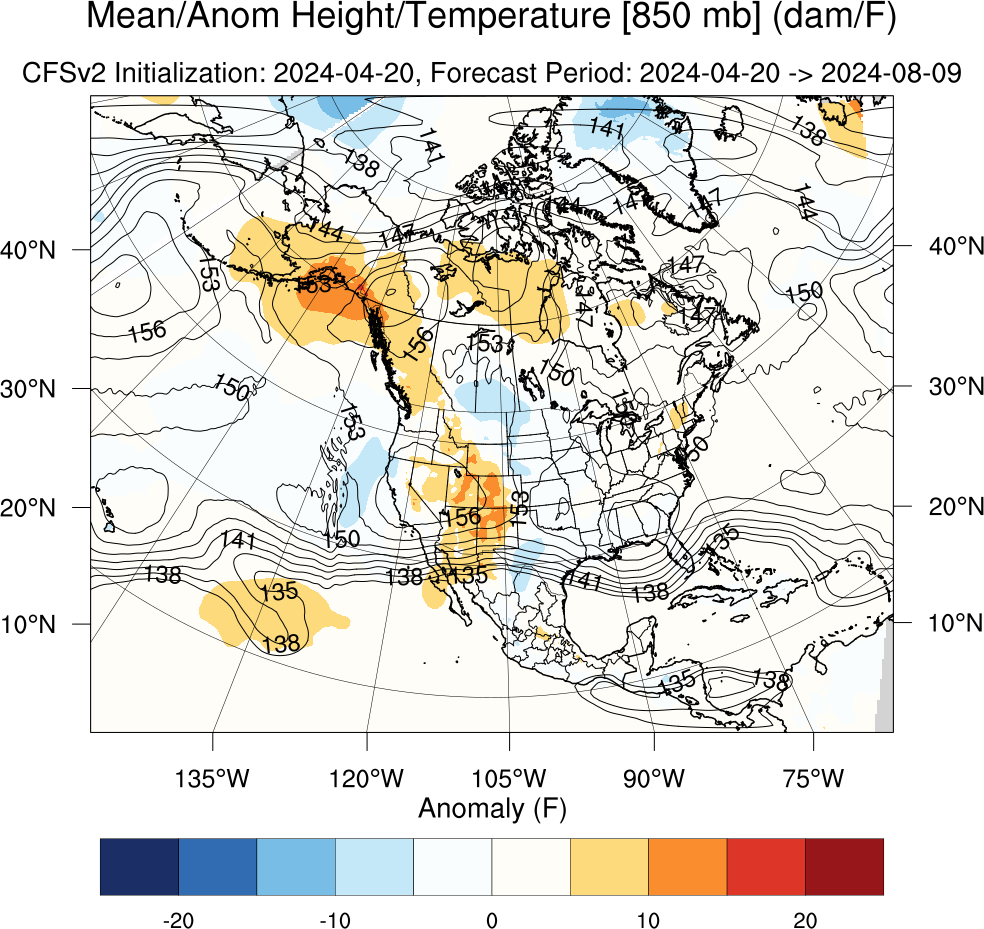
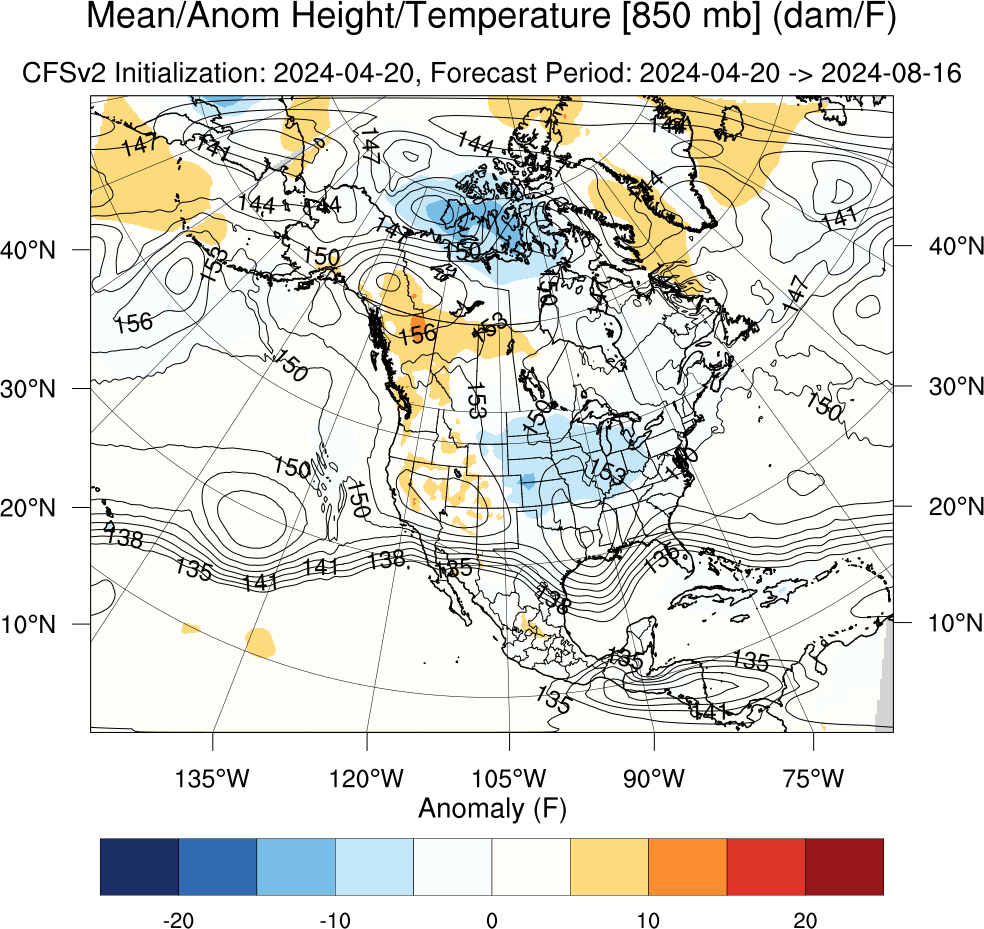
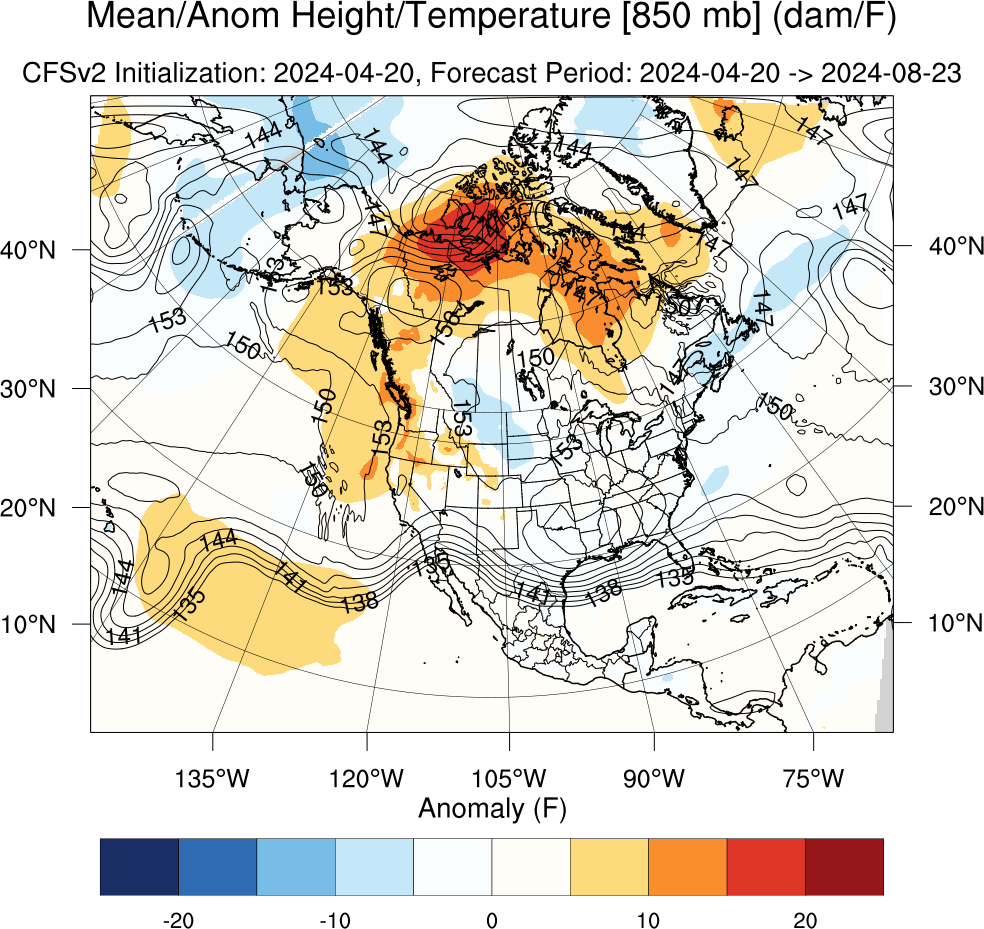
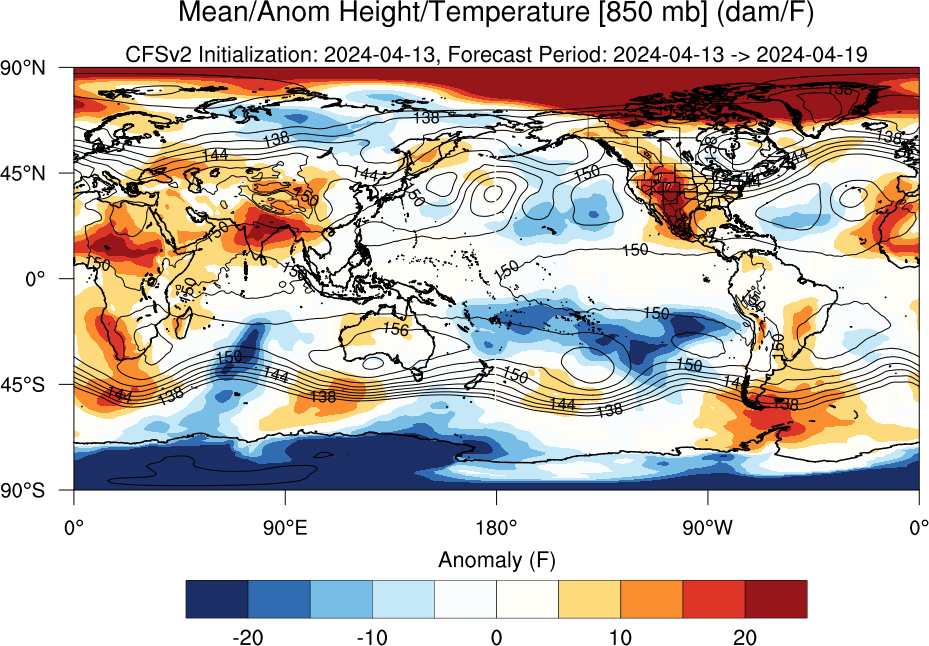
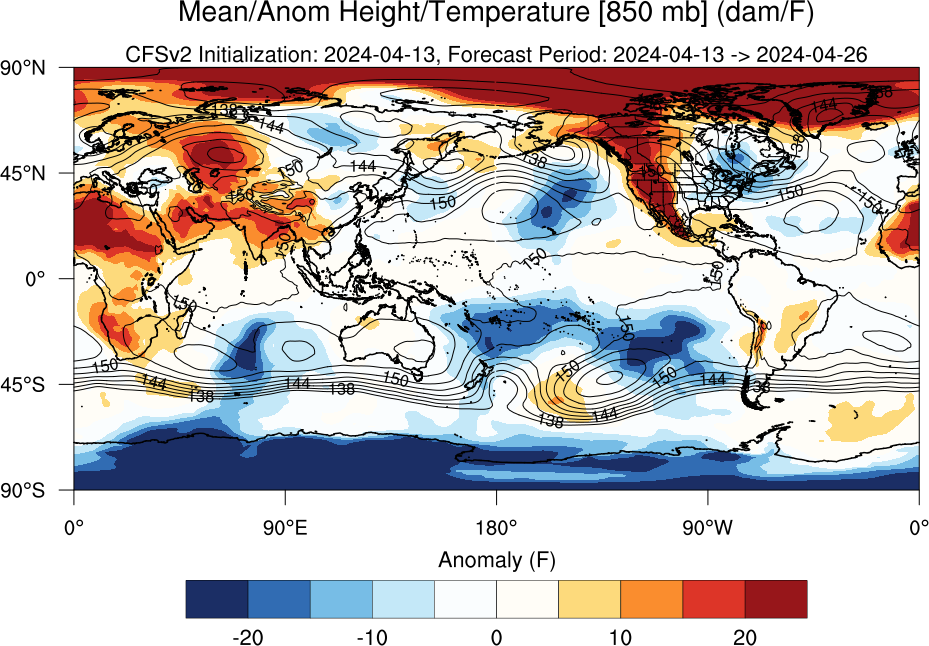
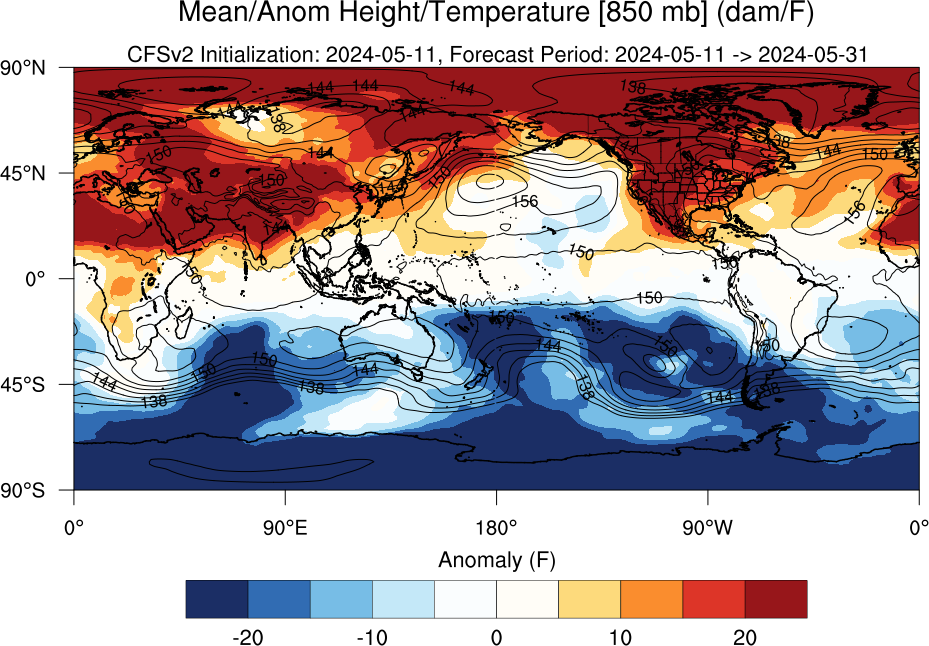
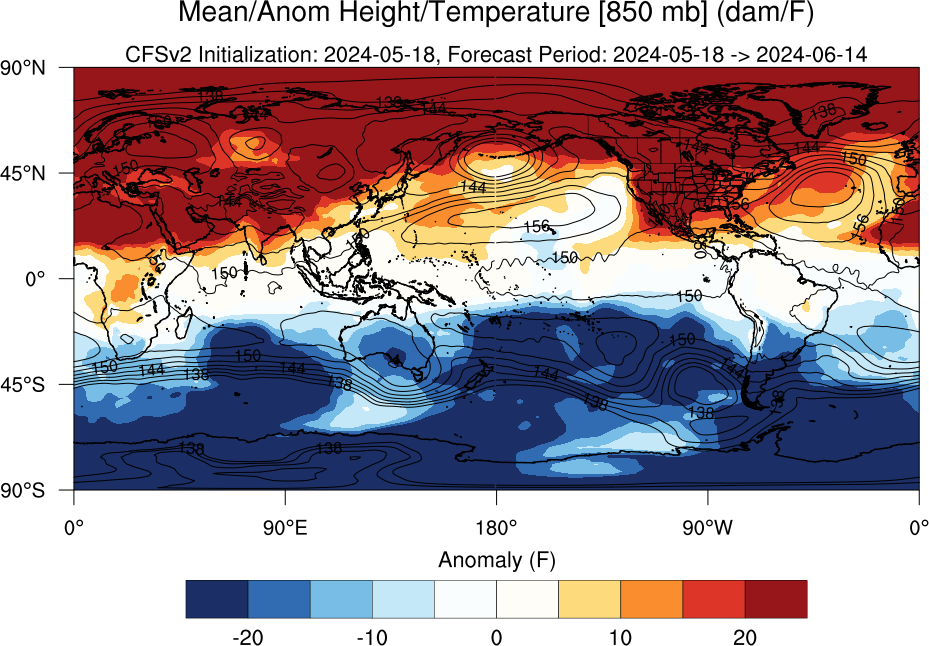
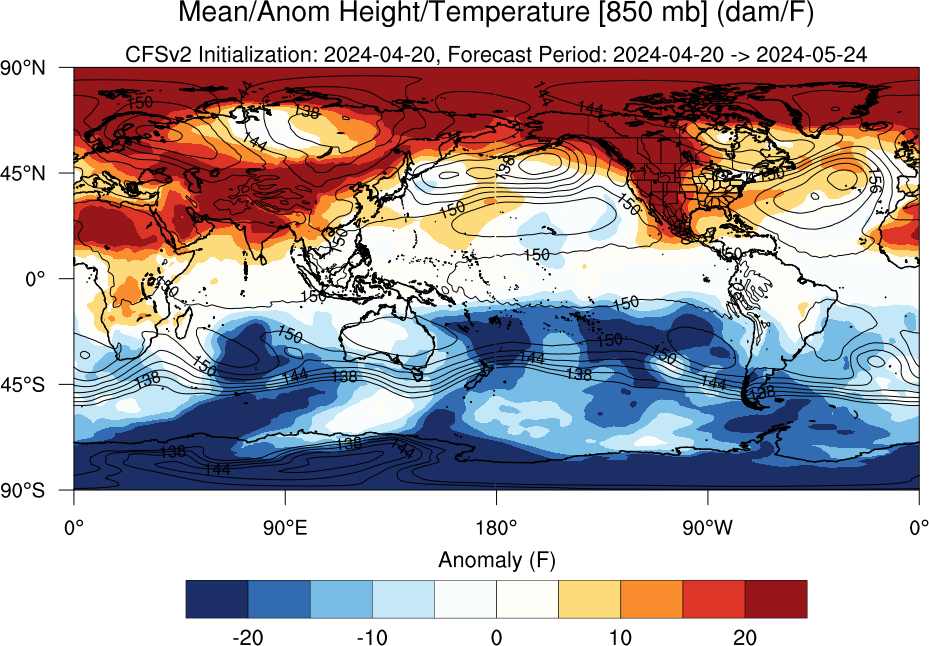
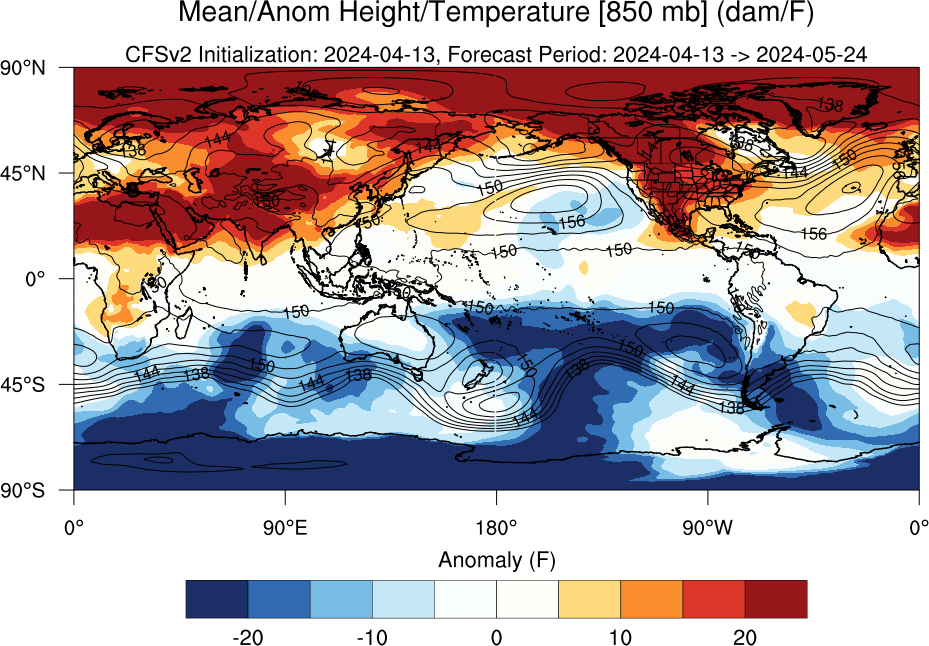
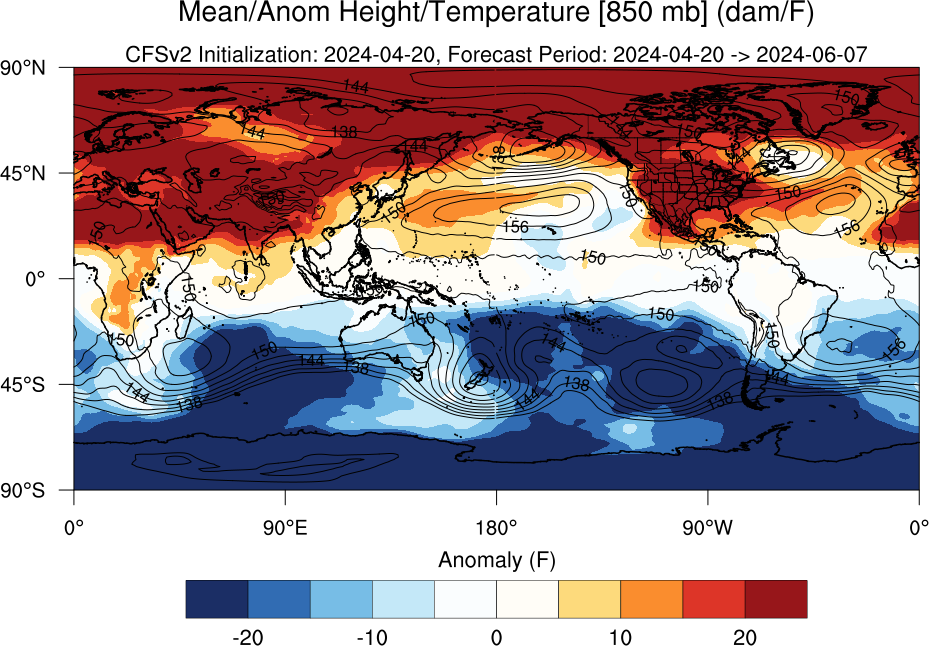
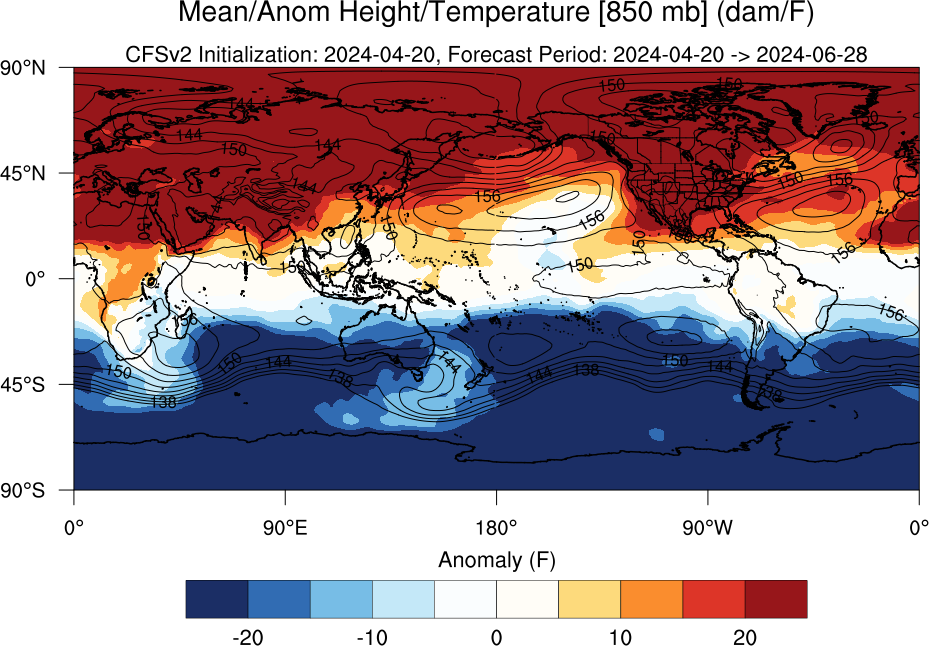
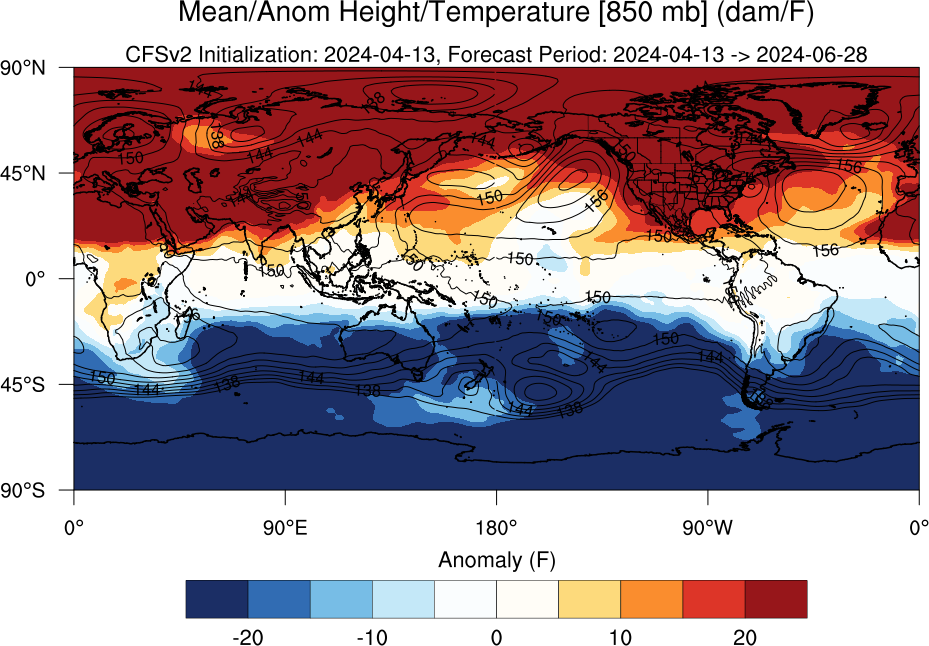
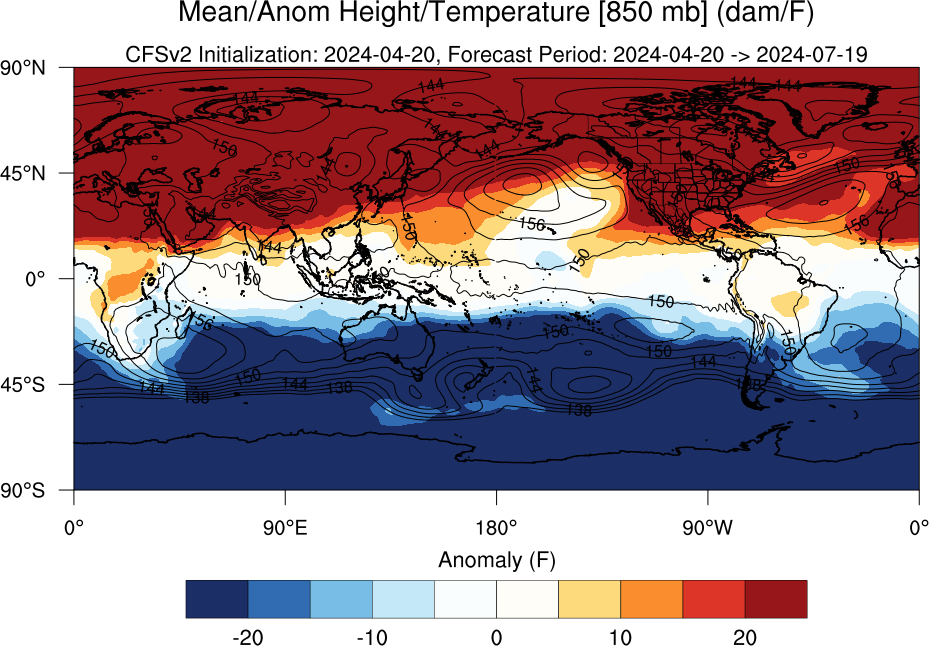
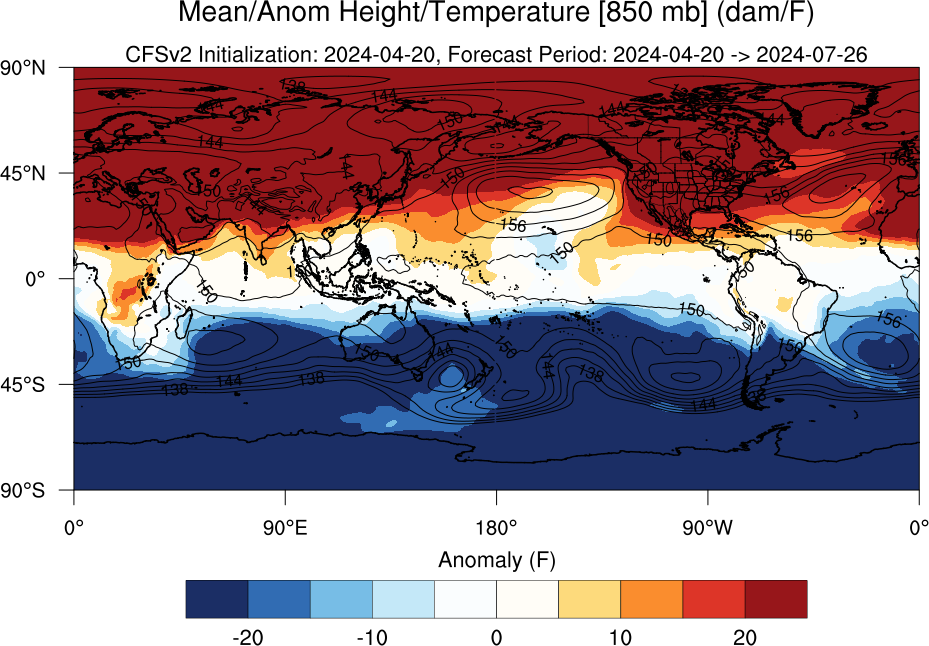
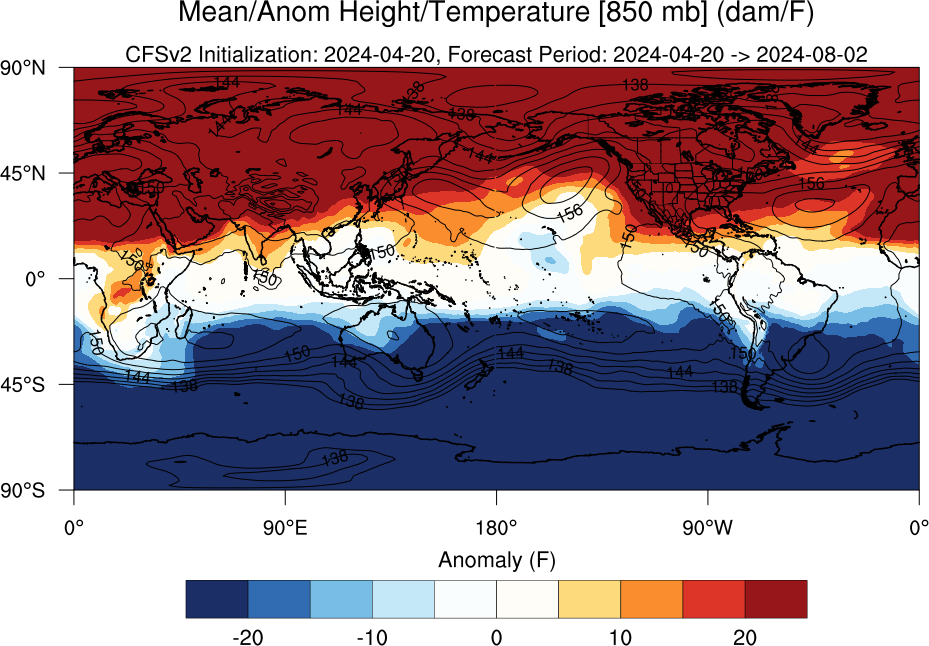
| Mean/Anom Height/Temperature [850 mb] (dam/F) | Loop | Grid | 18Jul | 25Jul | 01Aug | 08Aug | 15Aug | 22Aug | 29Aug | 05Sep | 12Sep |
| 19Sep | 26Sep | 03Oct | 10Oct | 17Oct | 24Oct | 31Oct | 07Nov | 14Nov | |||
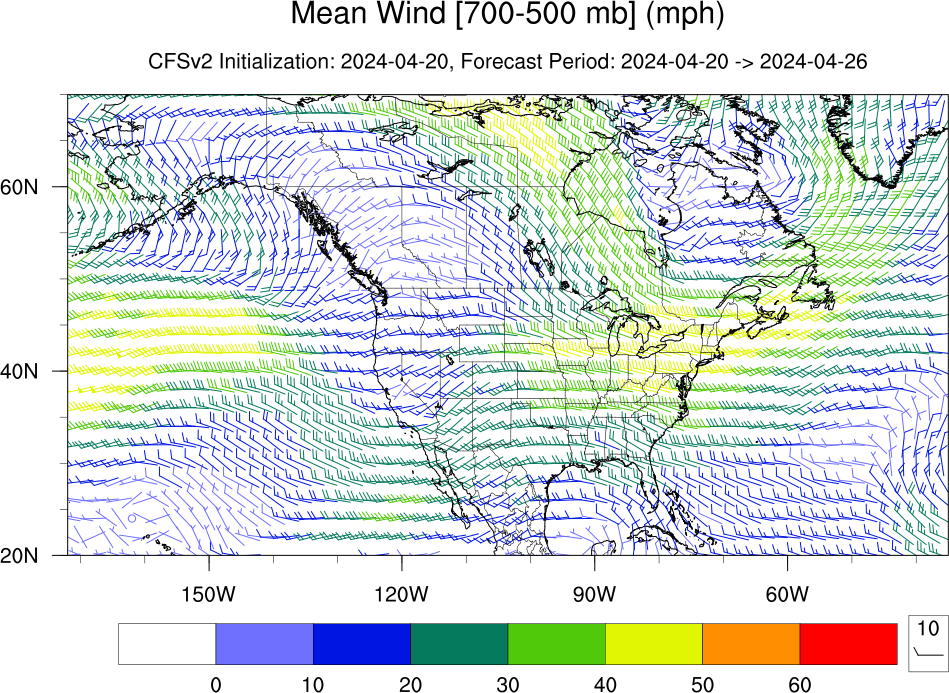
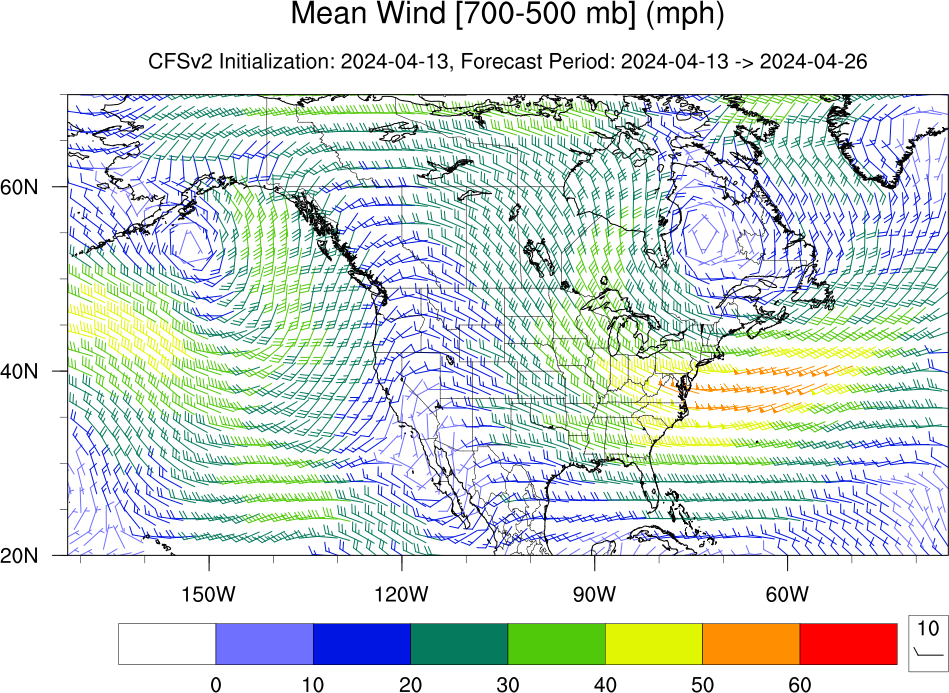
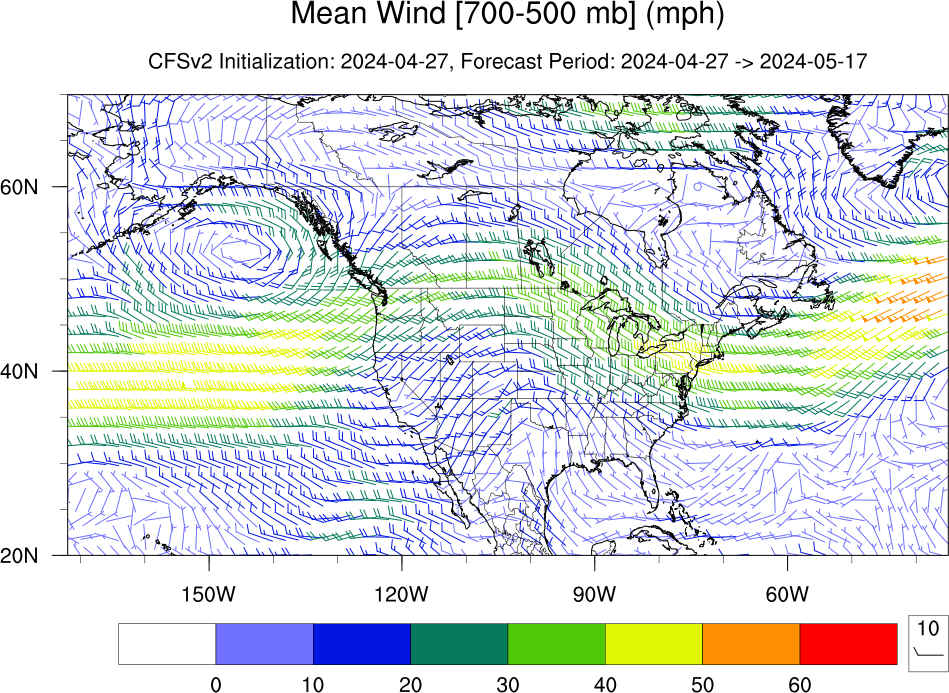
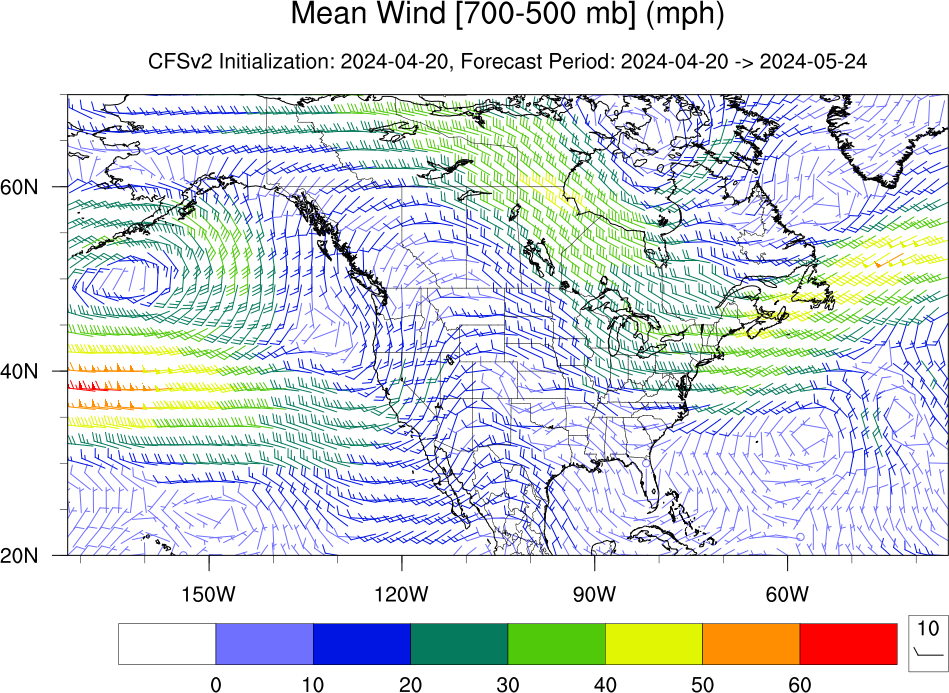
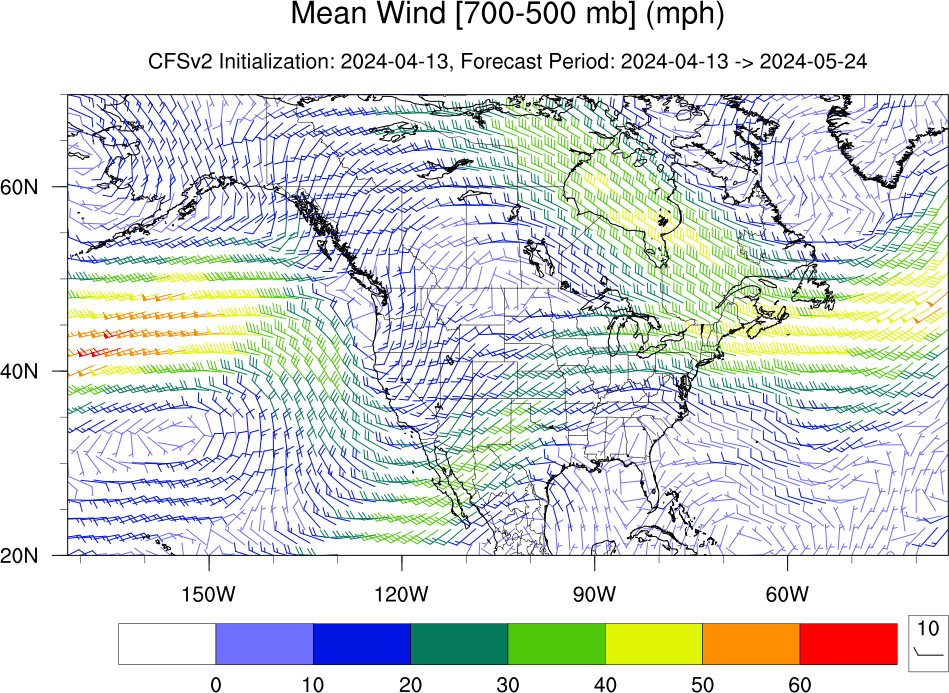
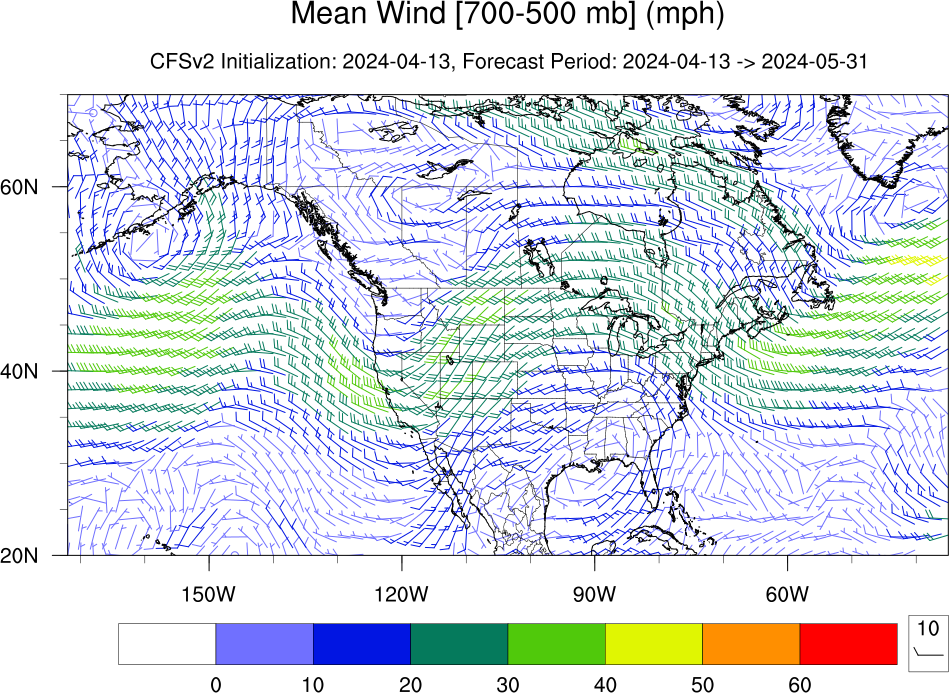
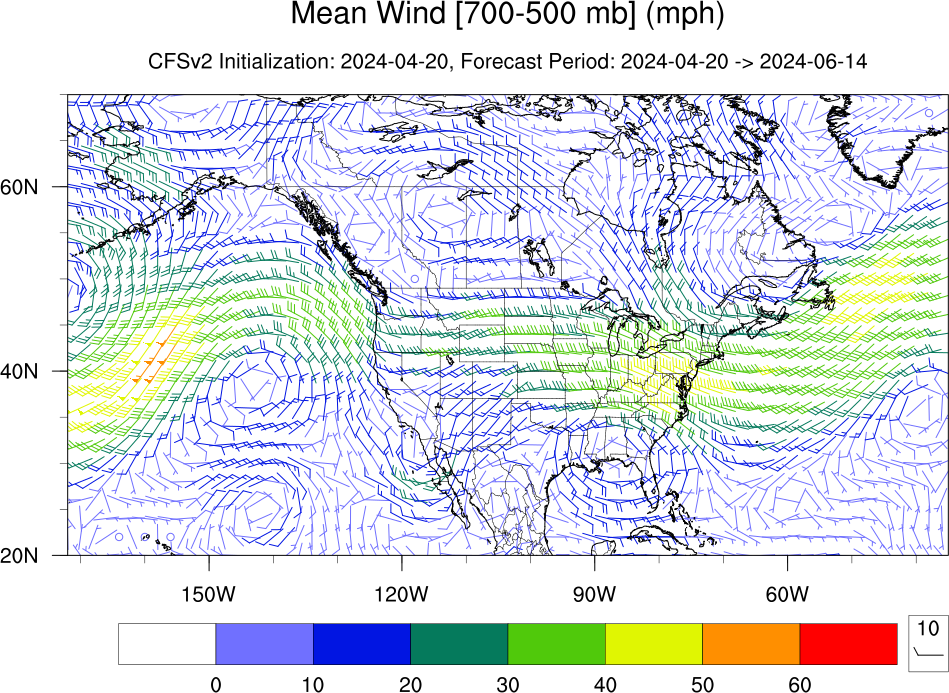
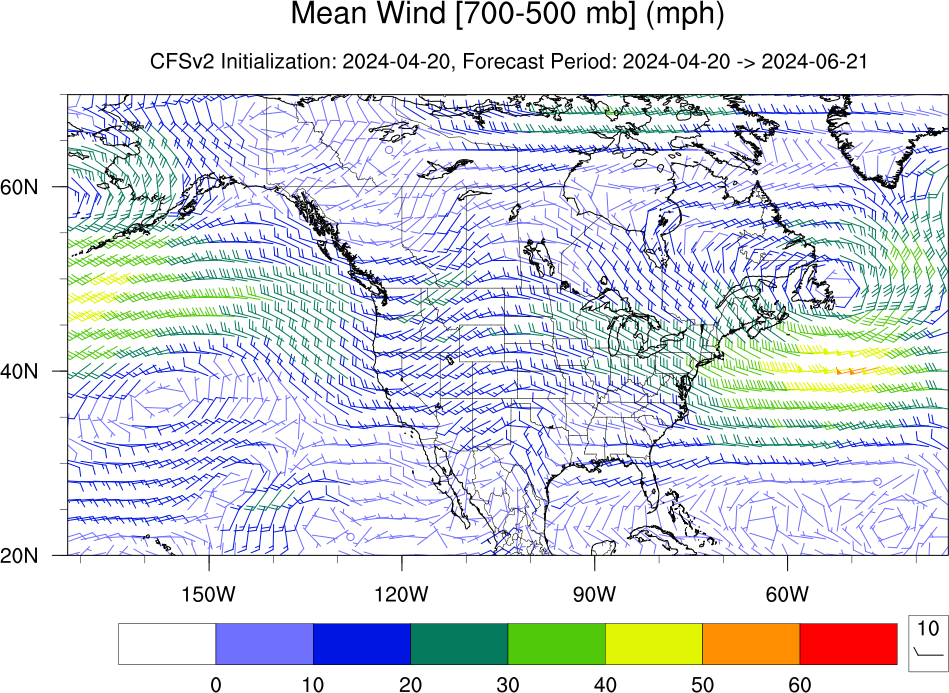
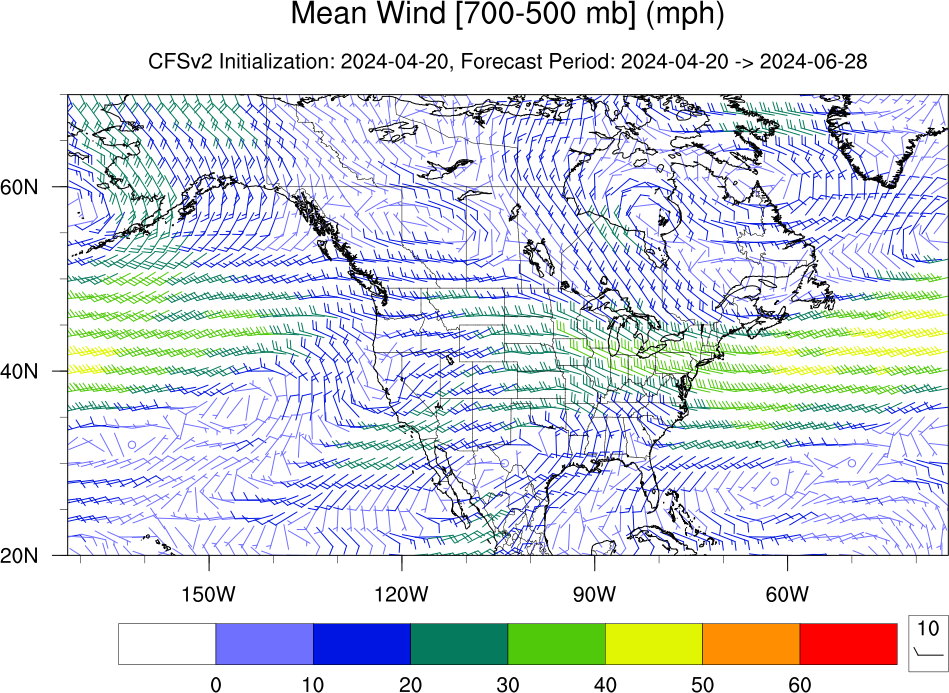
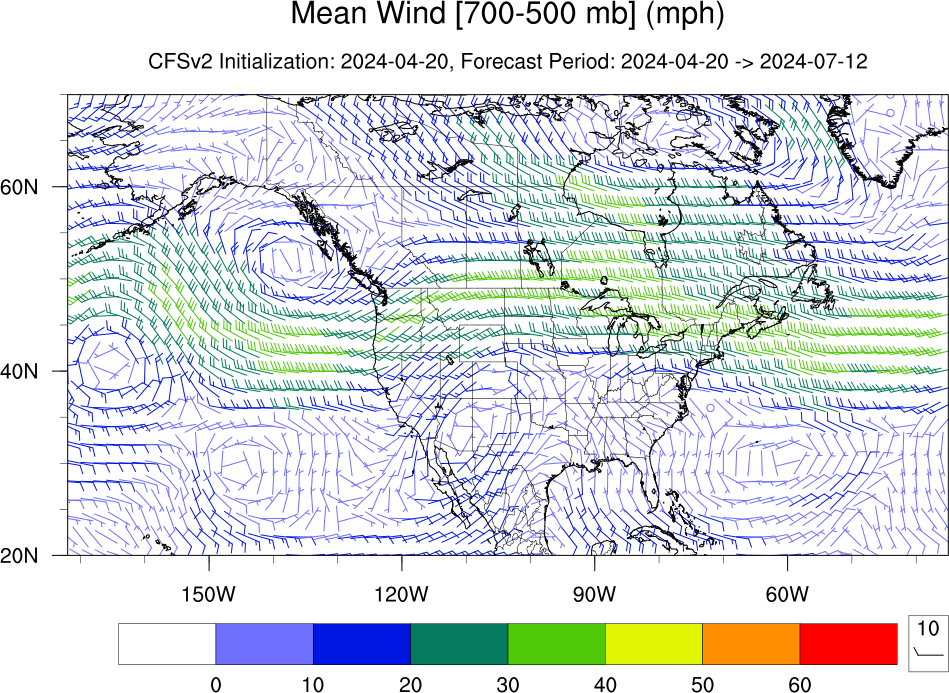
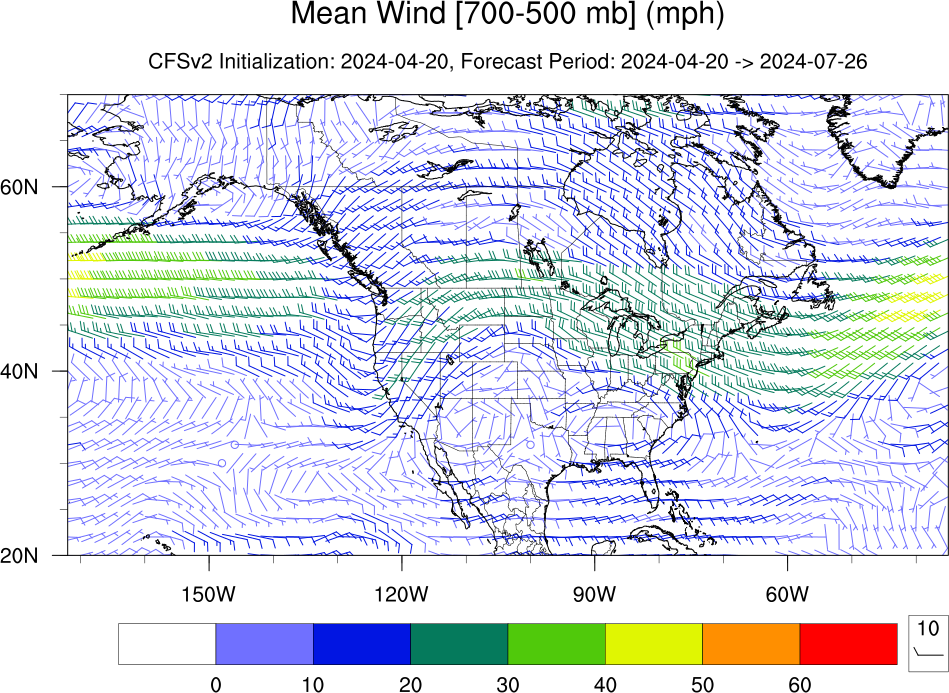
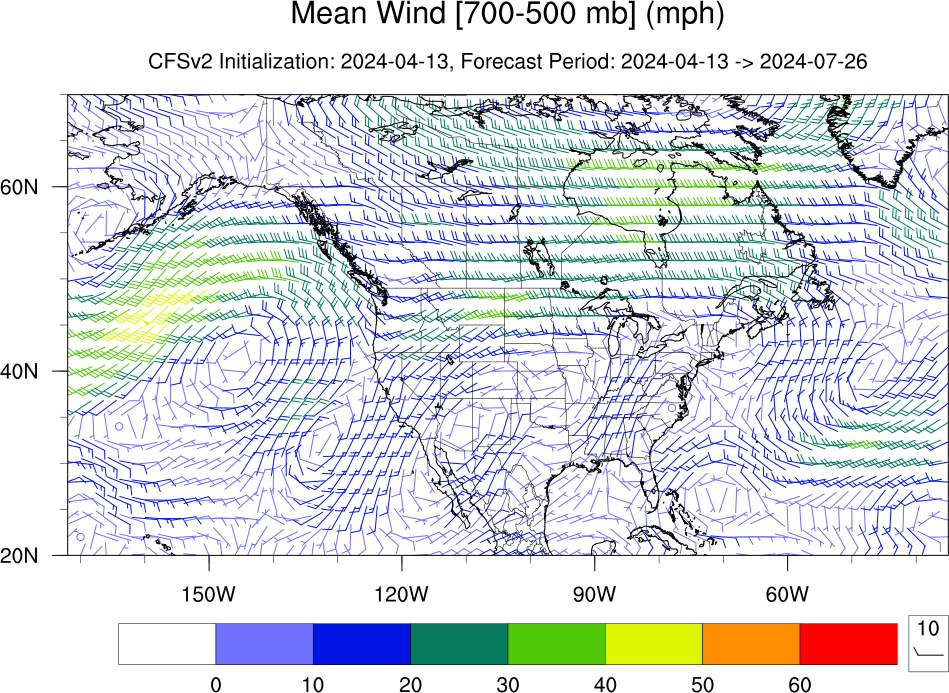
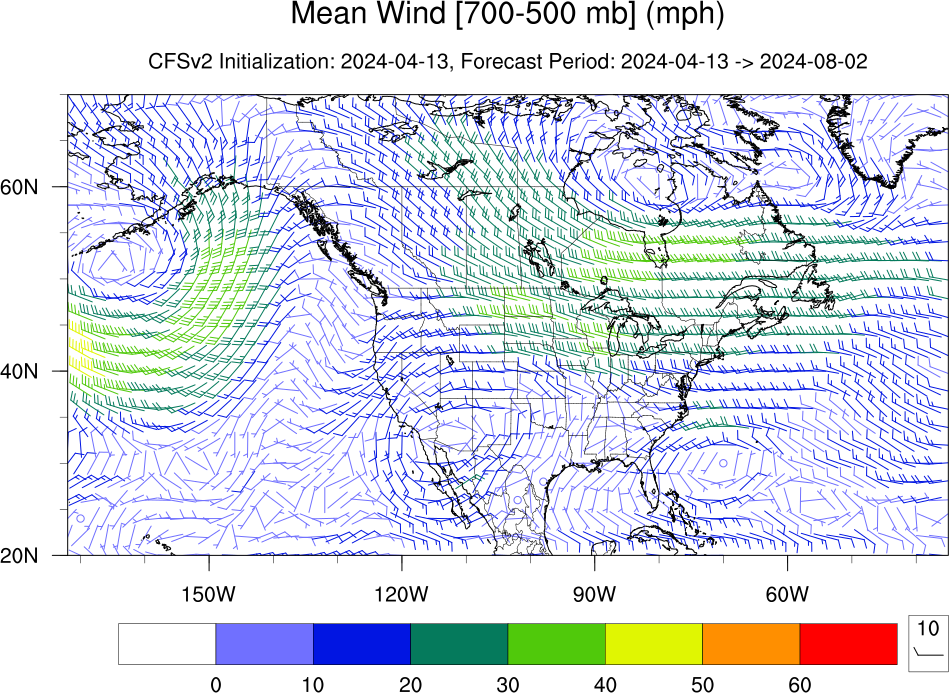
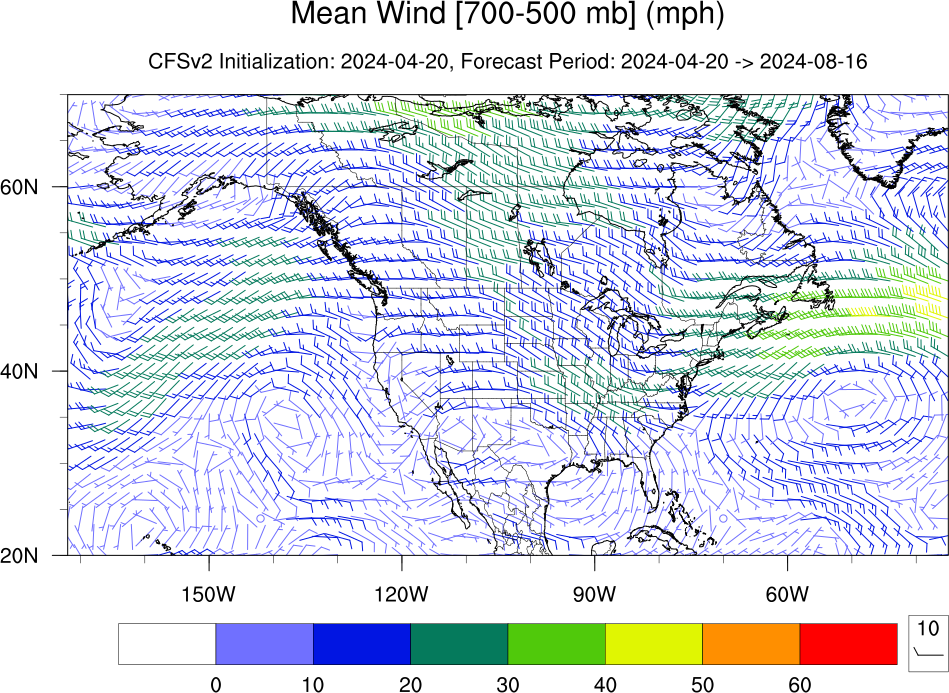
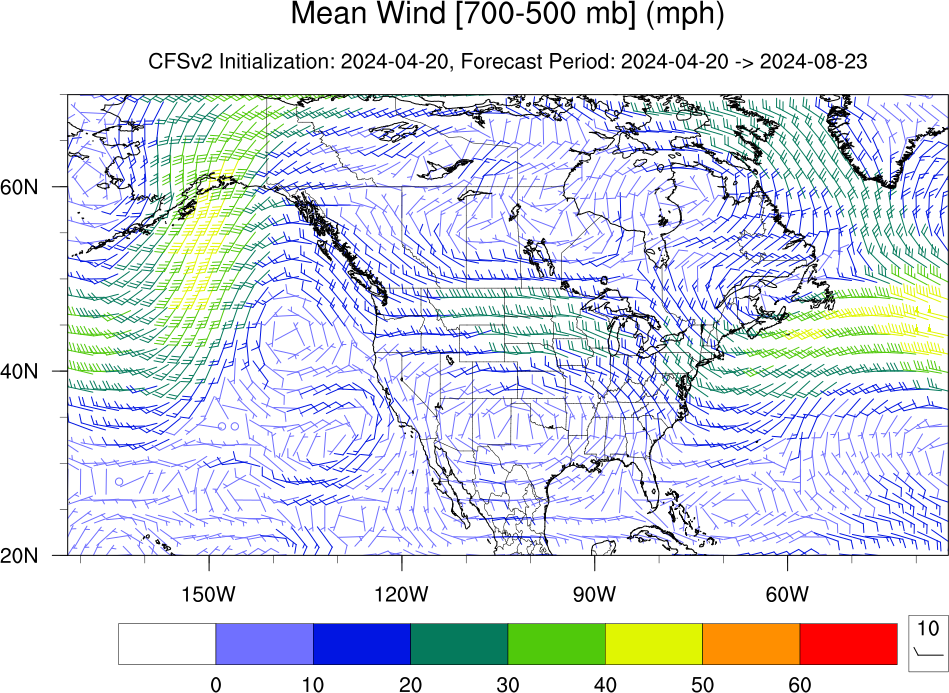
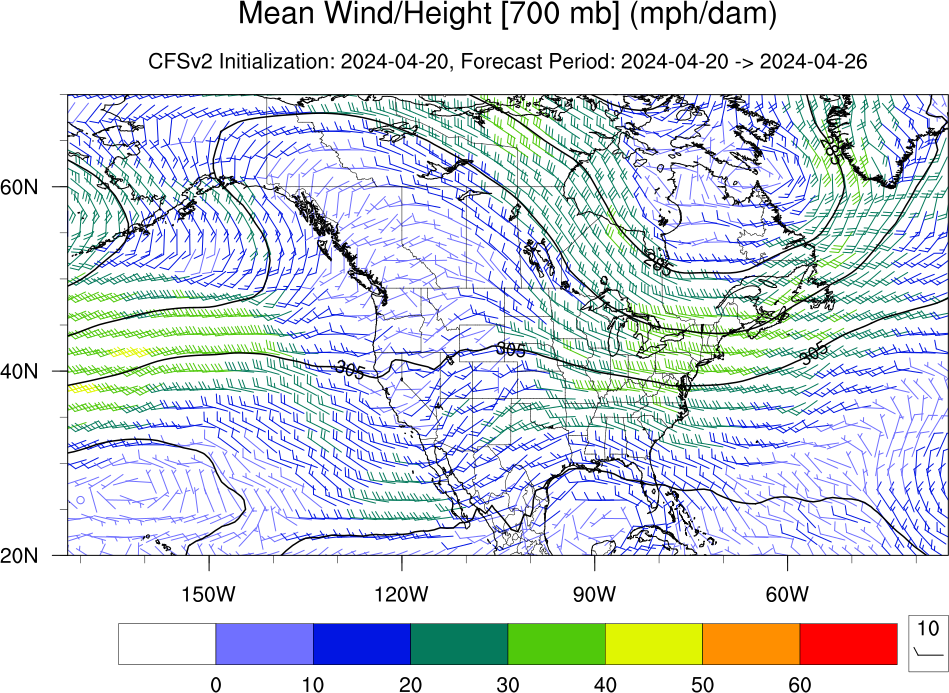
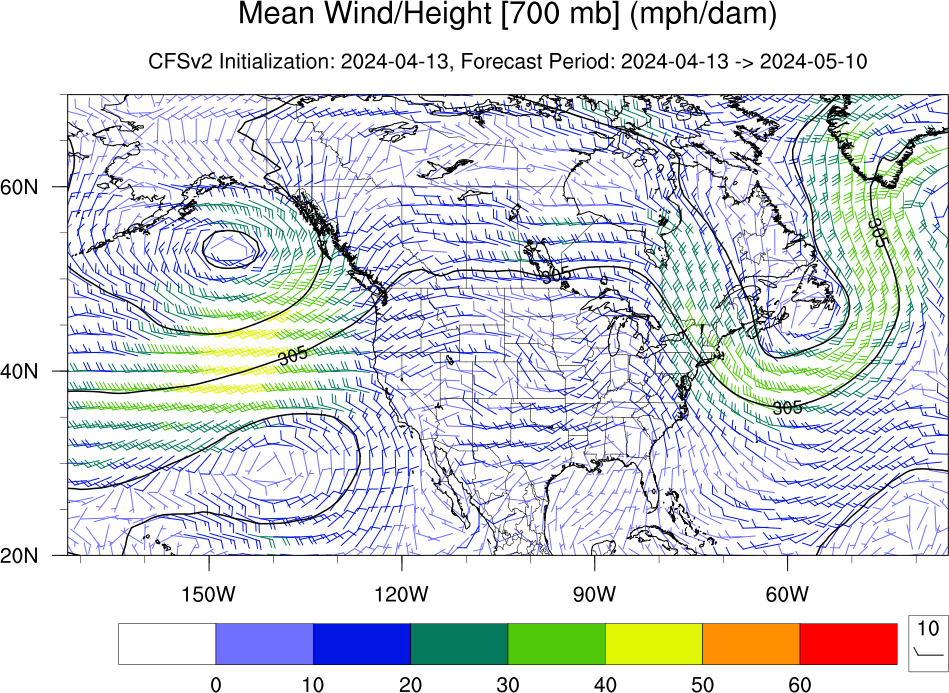
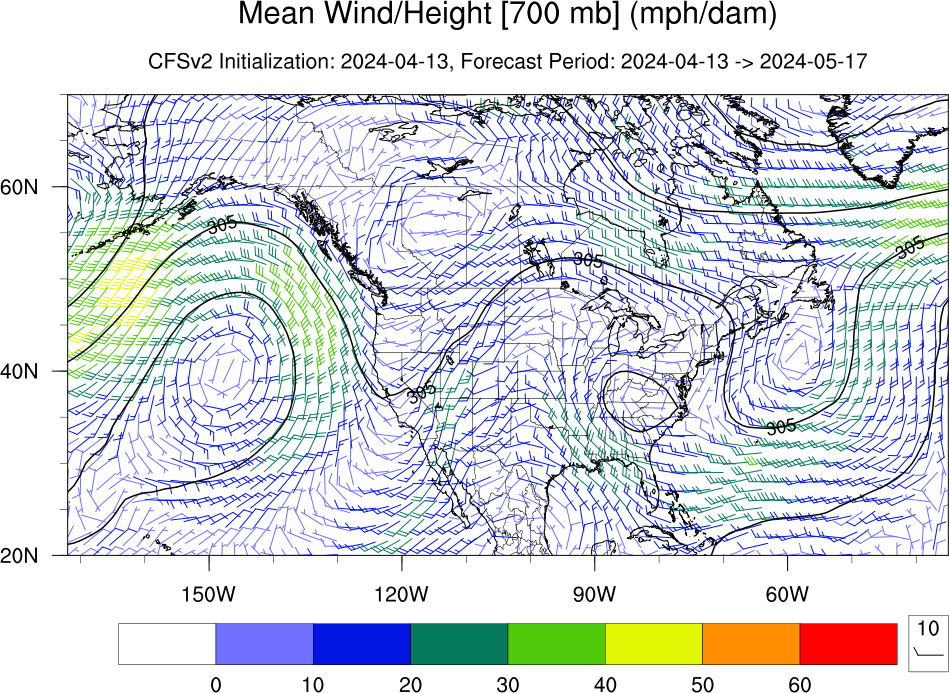
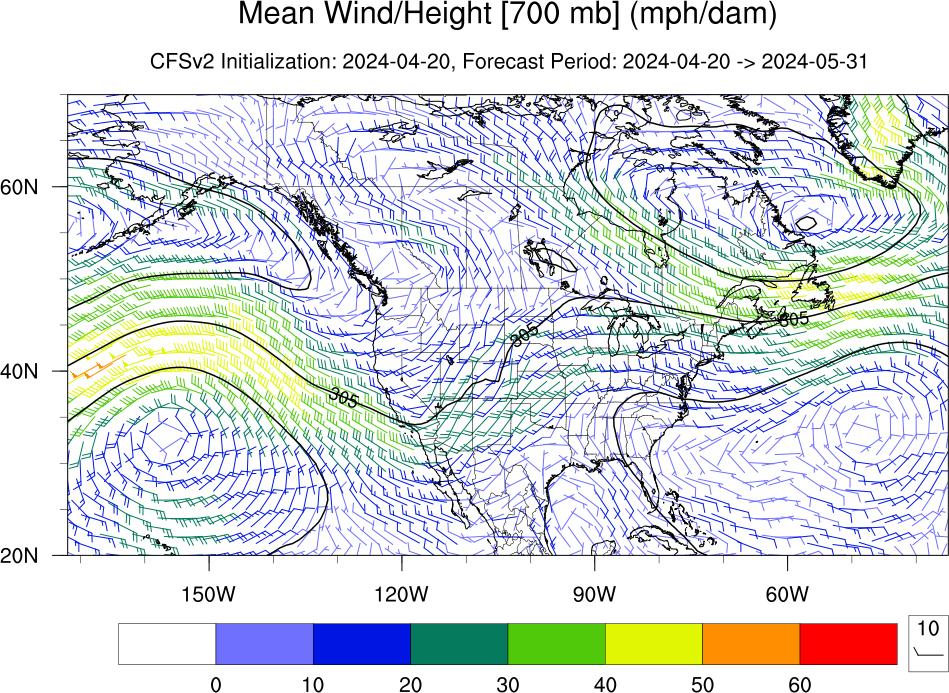
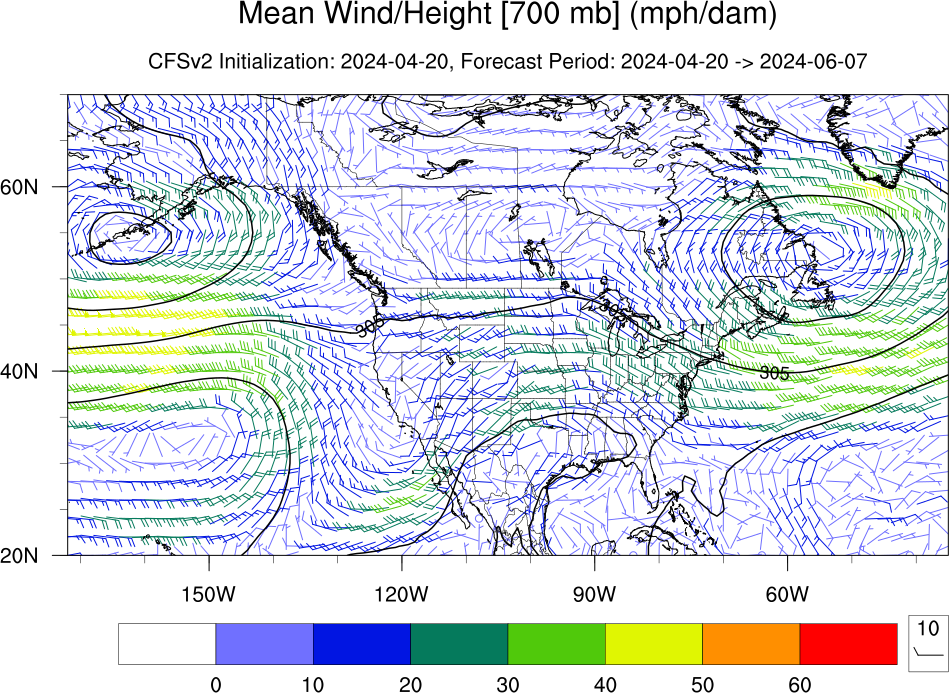
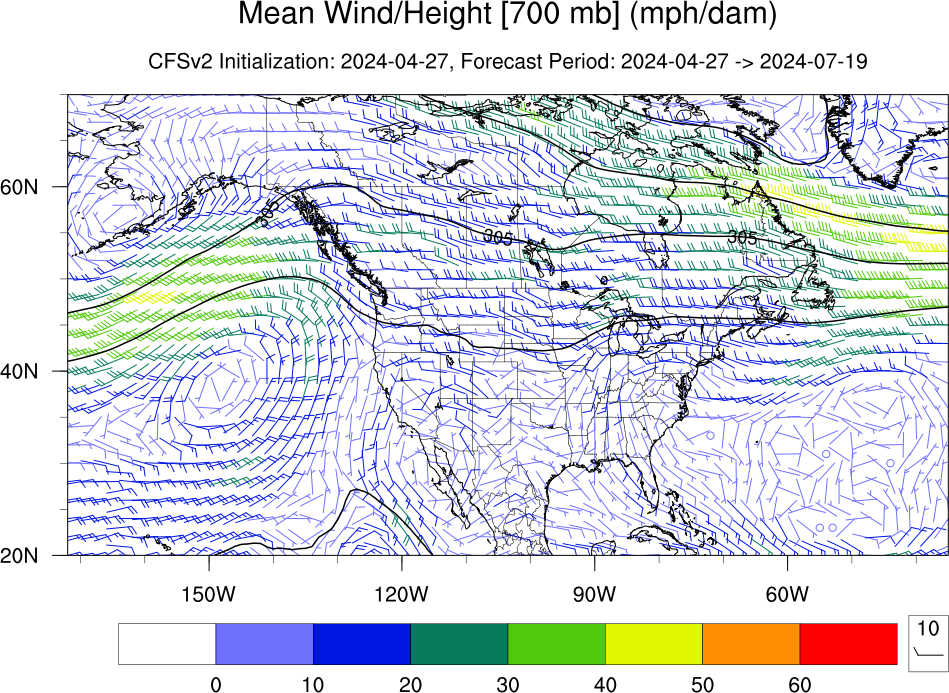
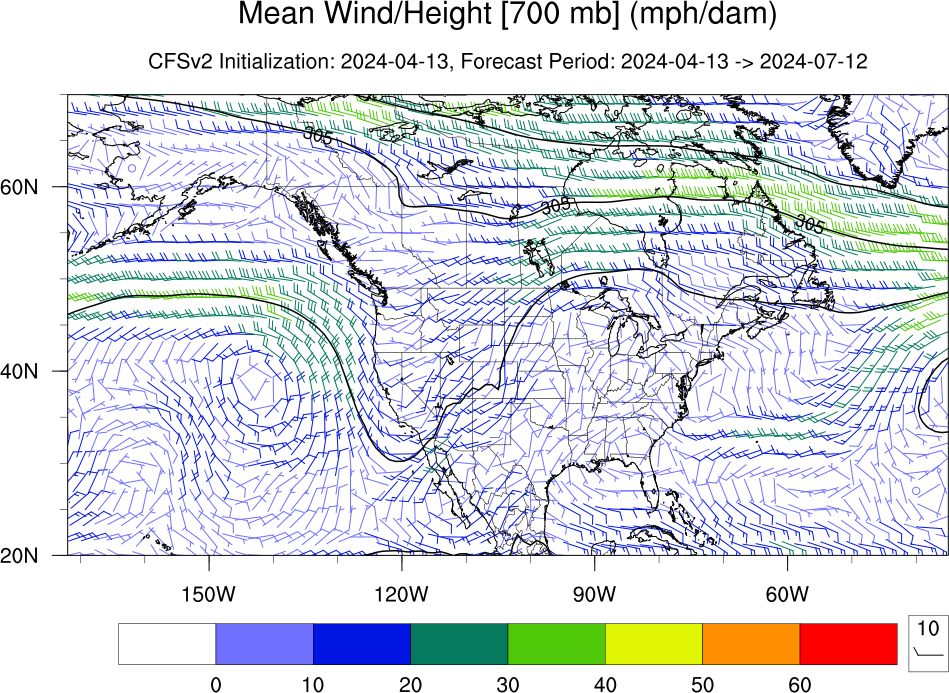
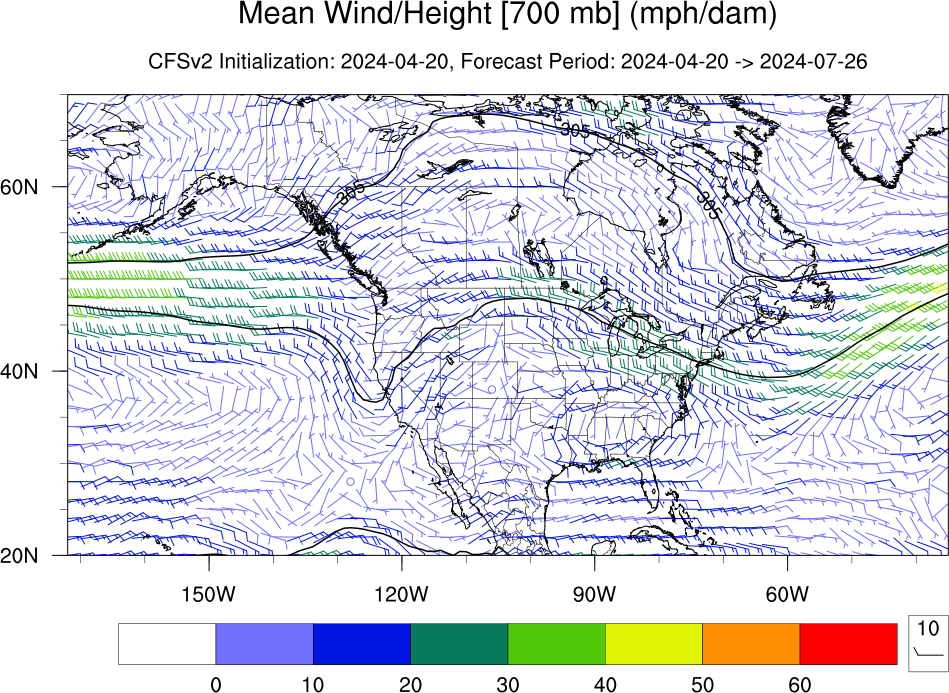
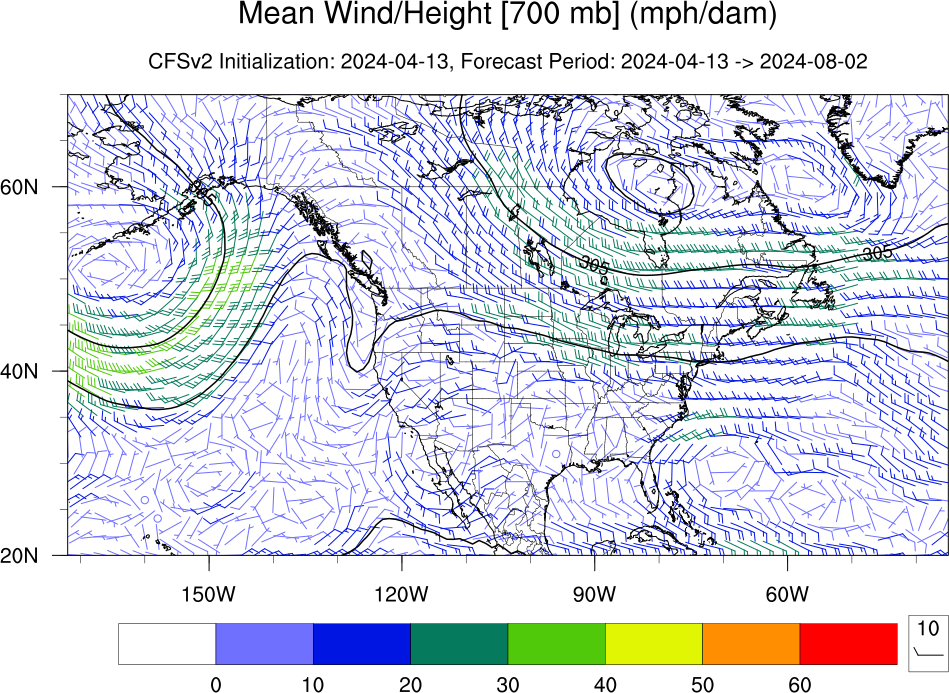
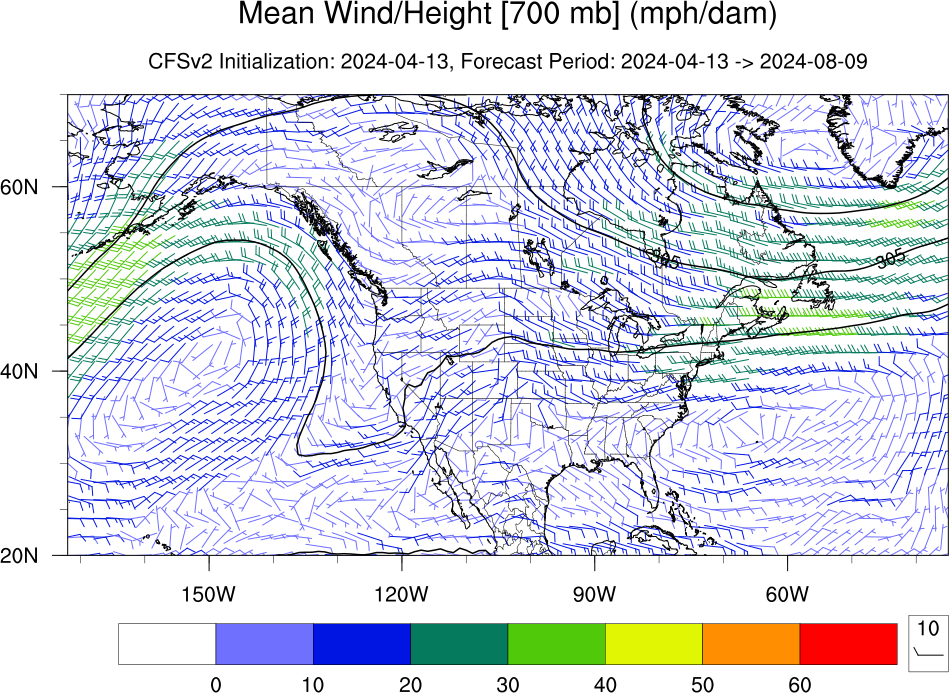
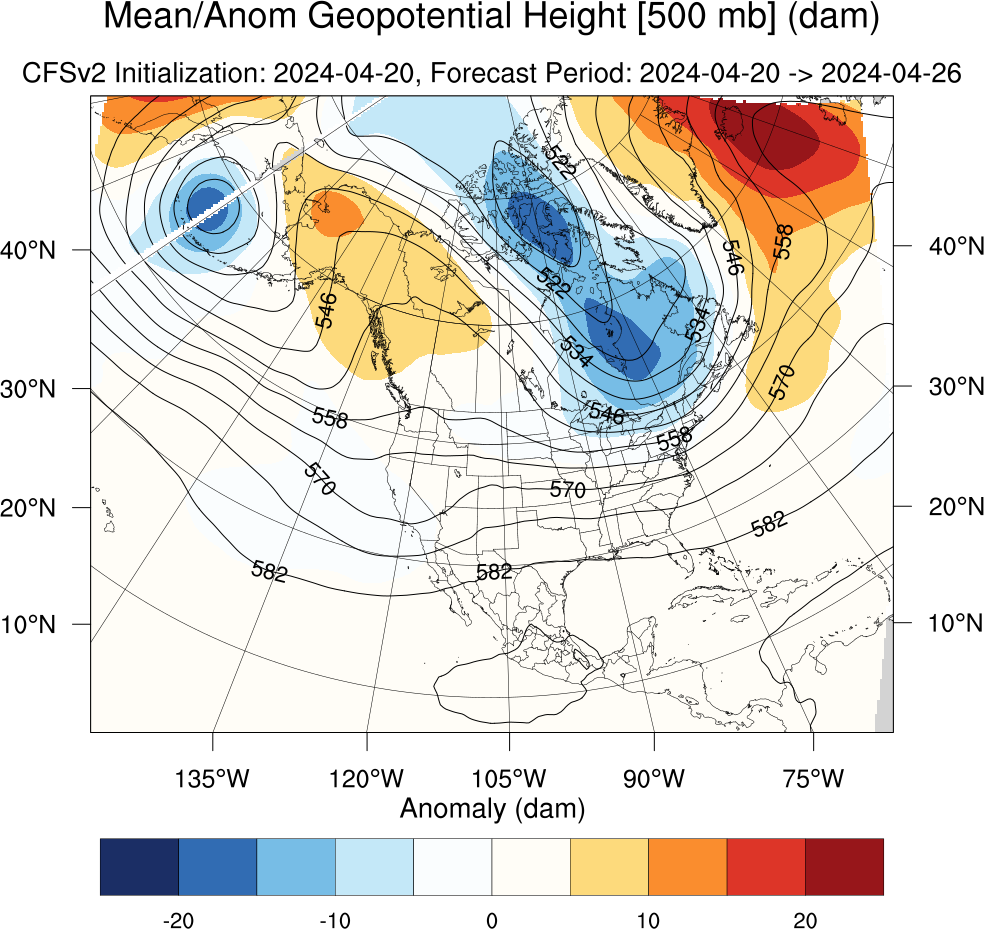
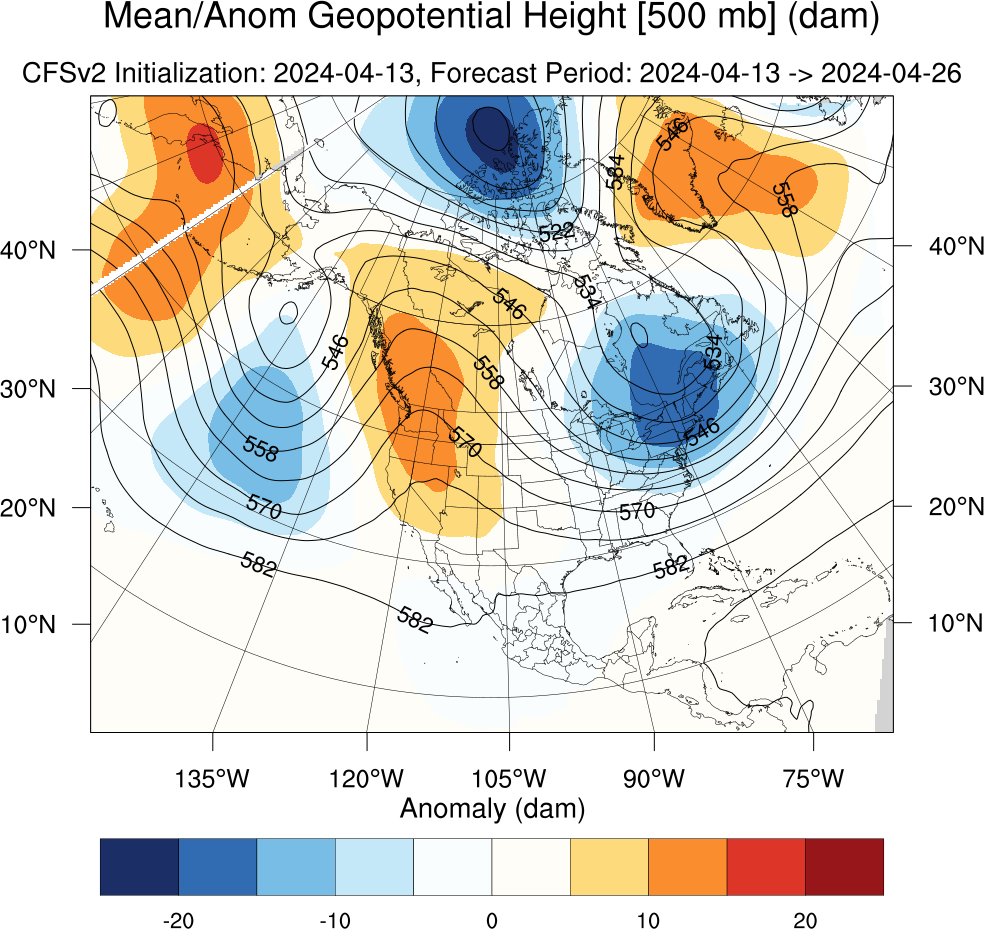
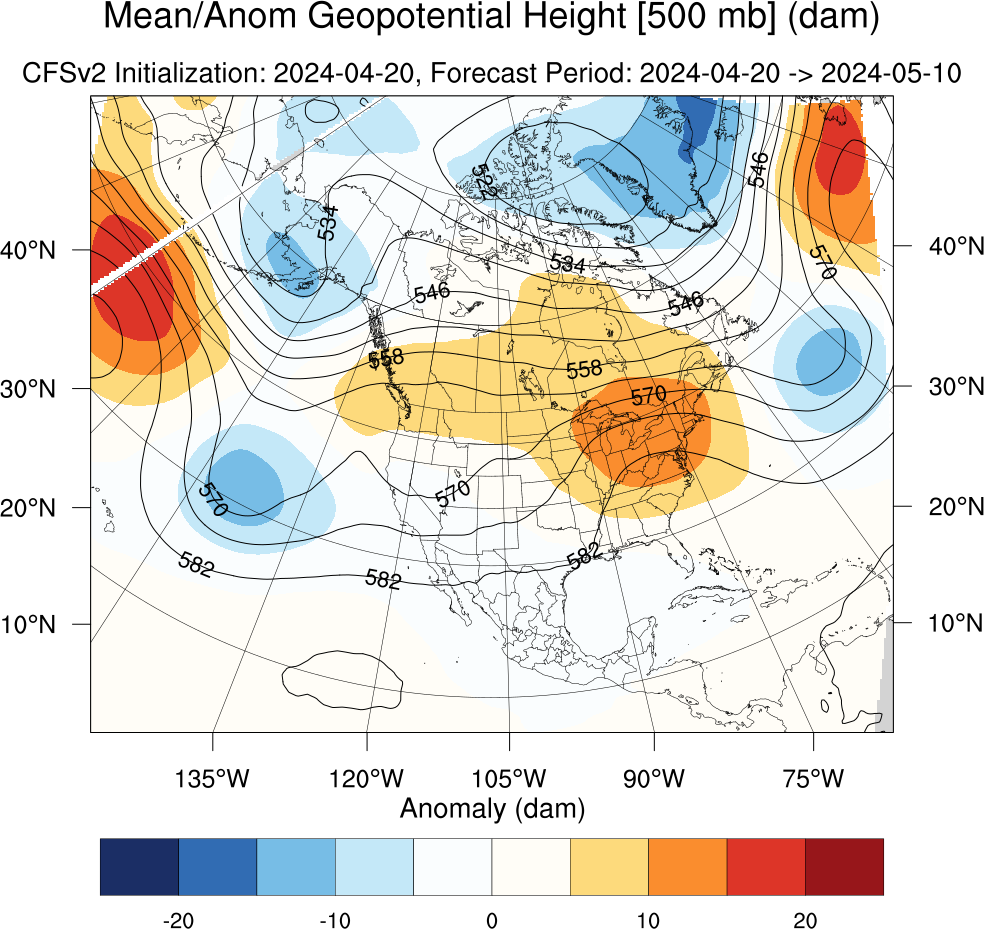
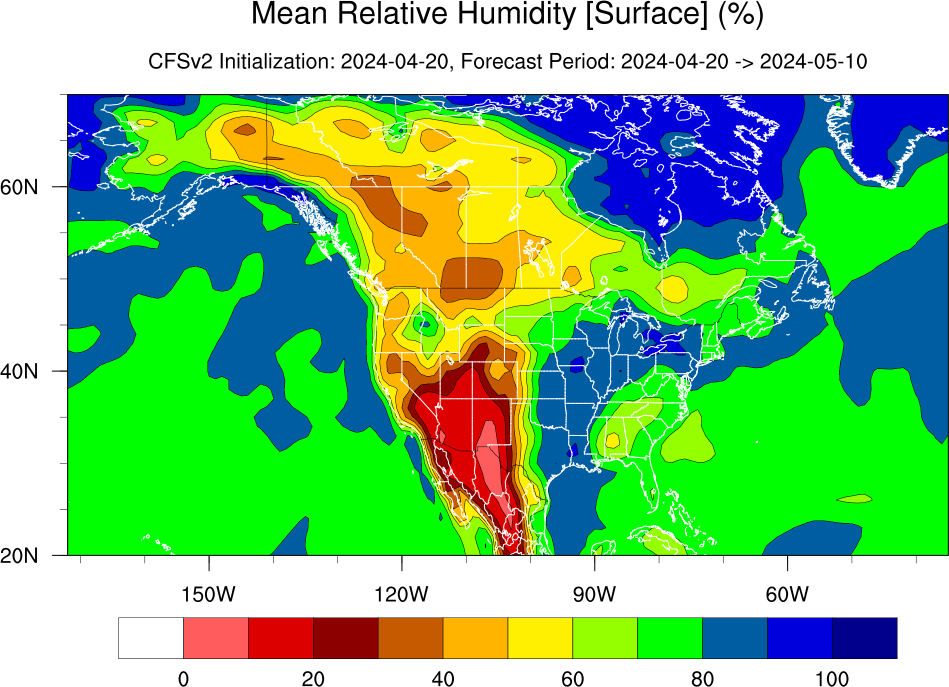
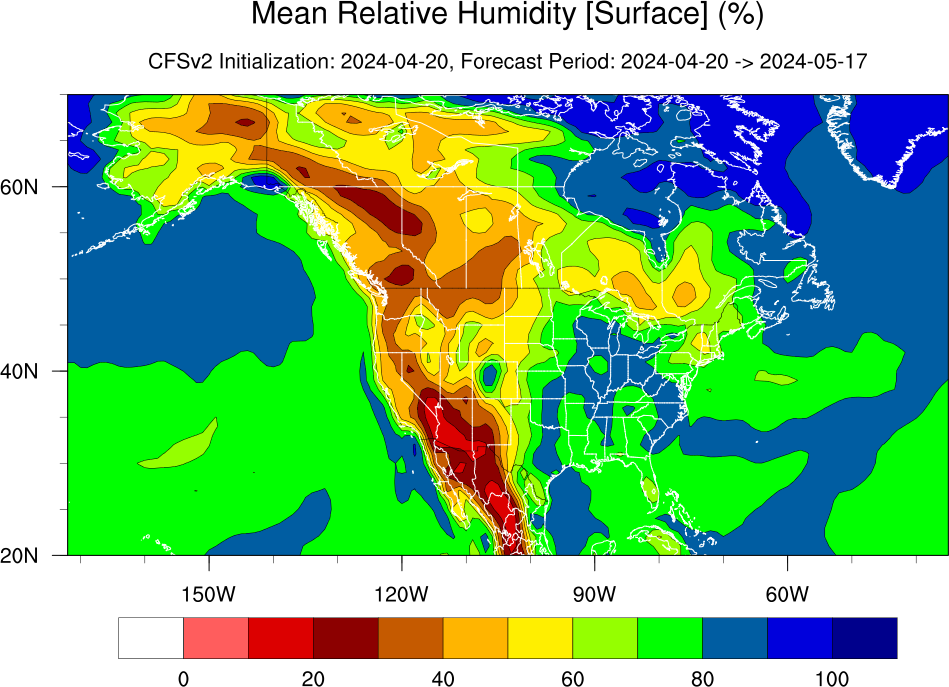
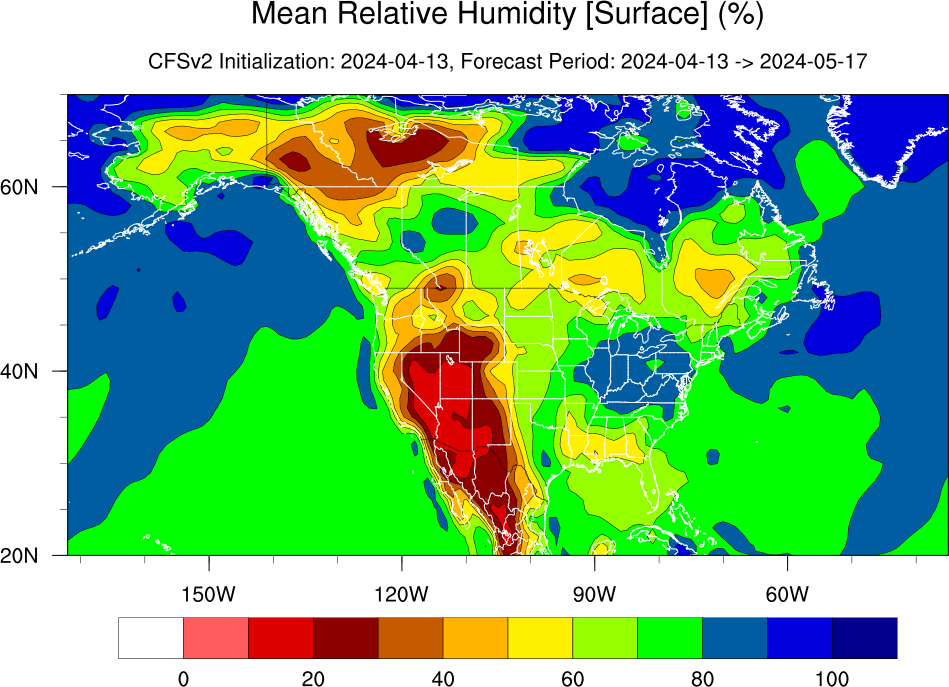
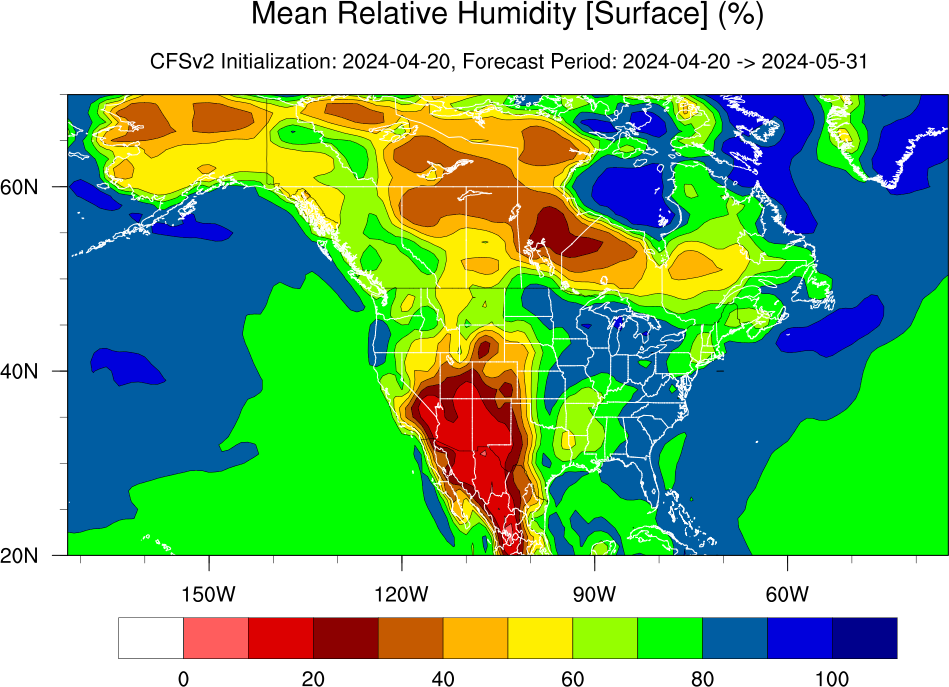
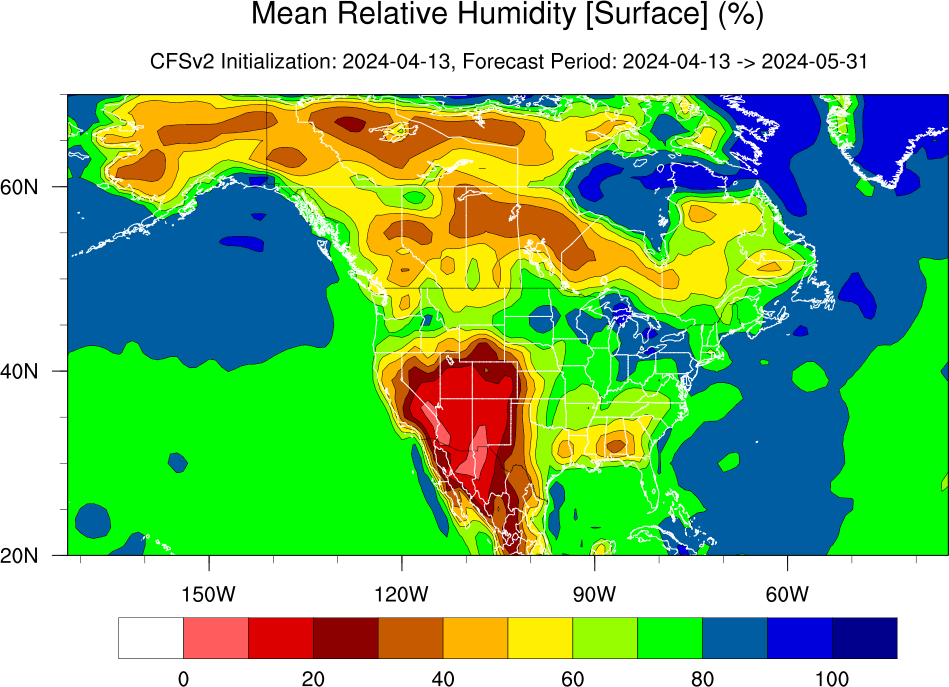
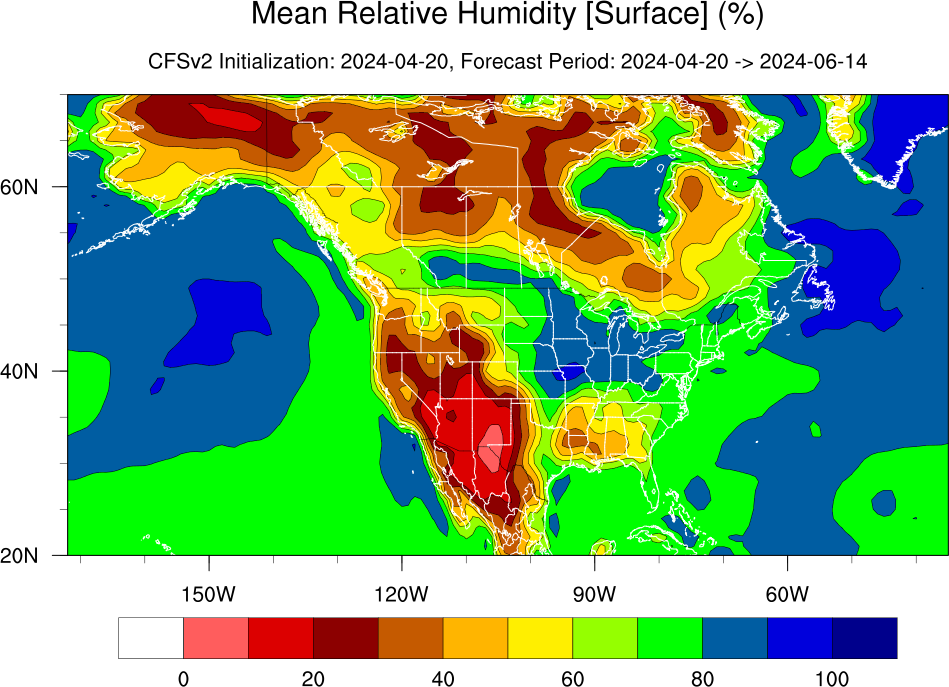
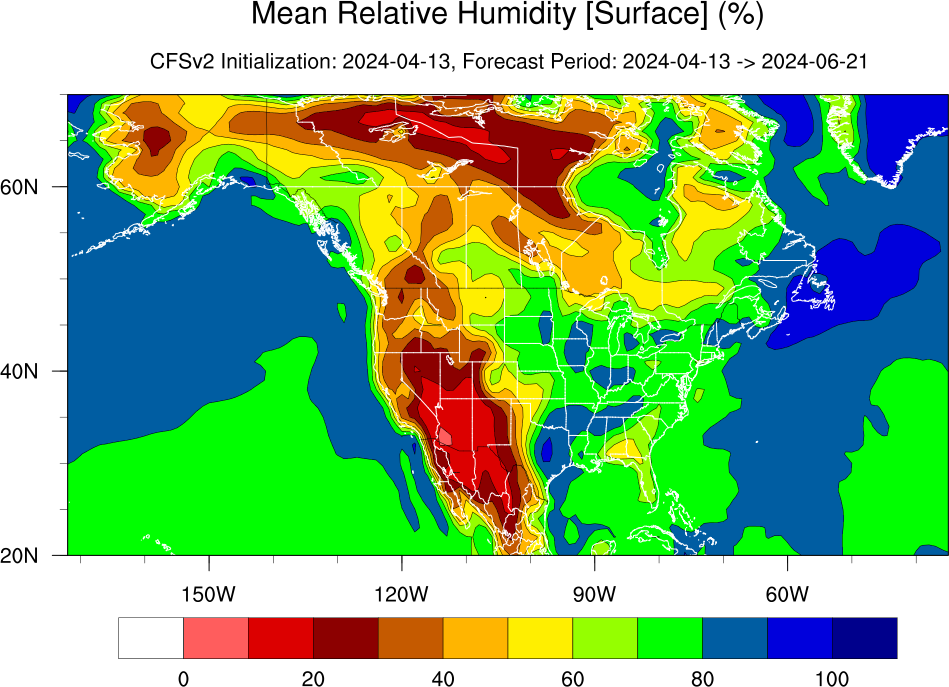
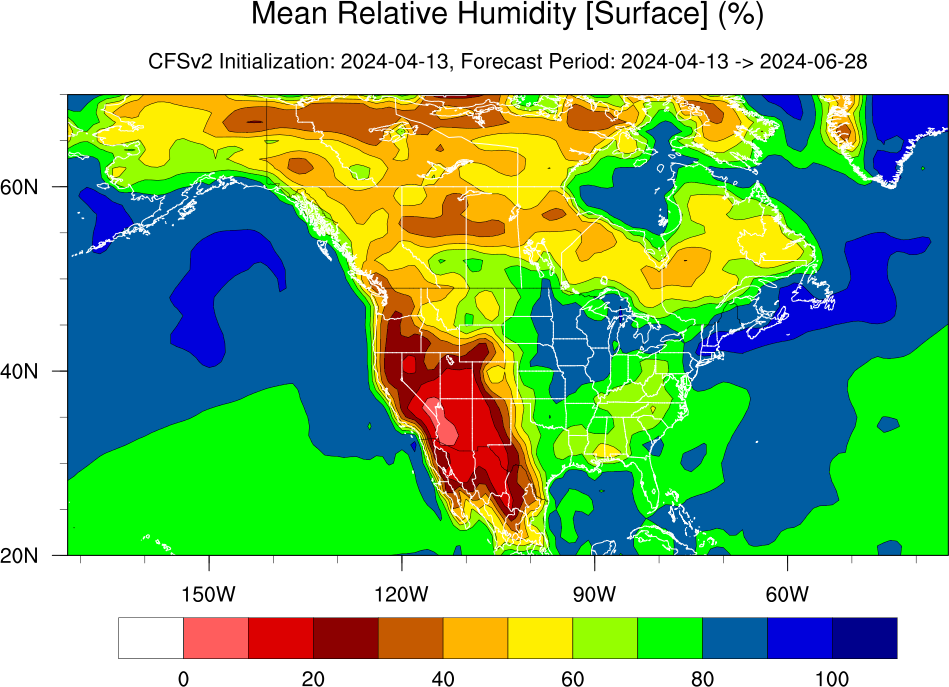
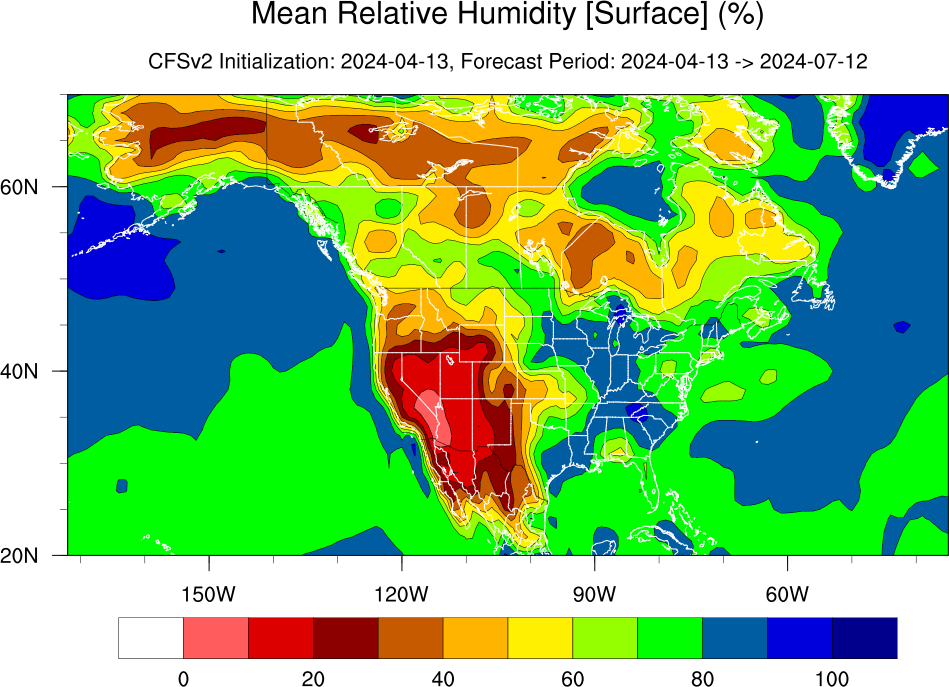
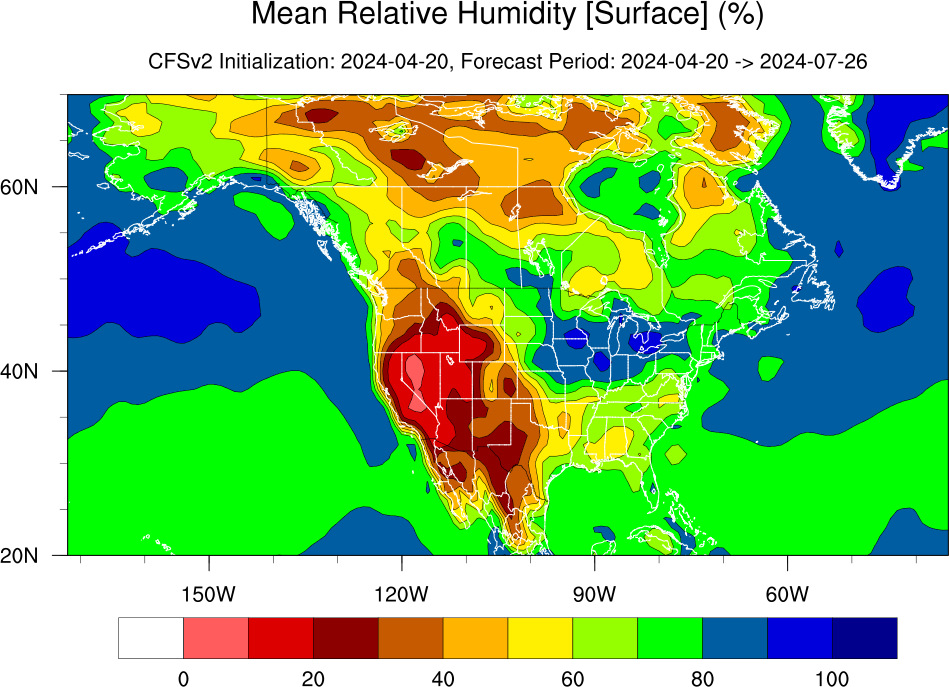
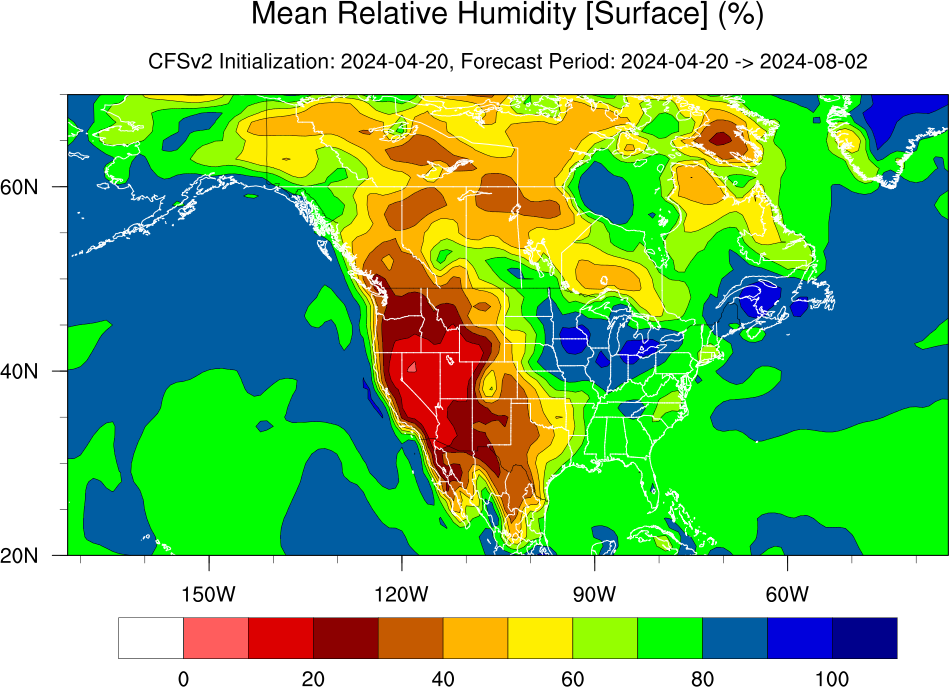
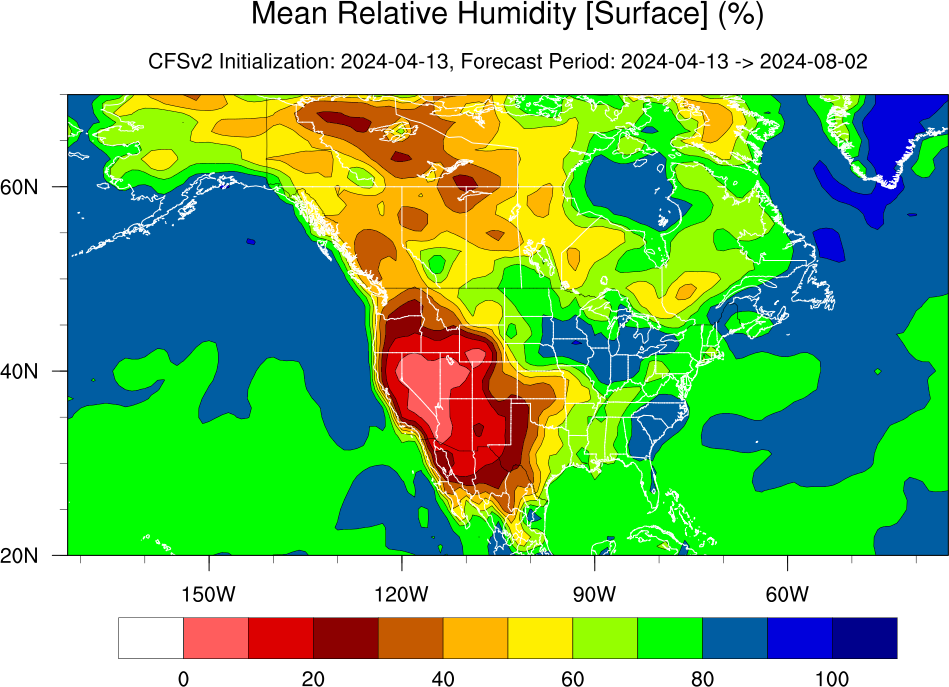
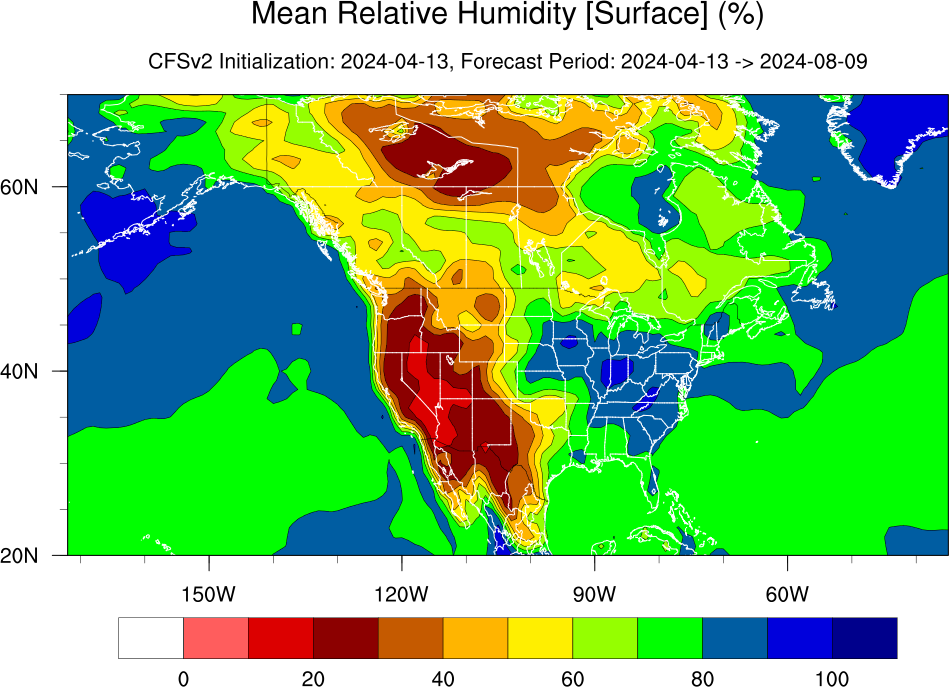
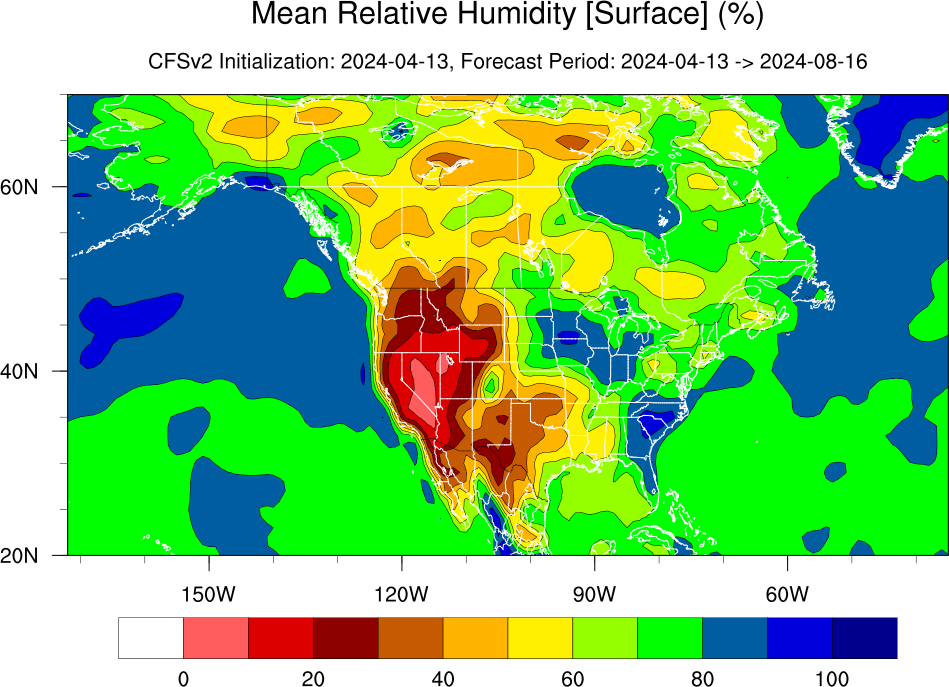
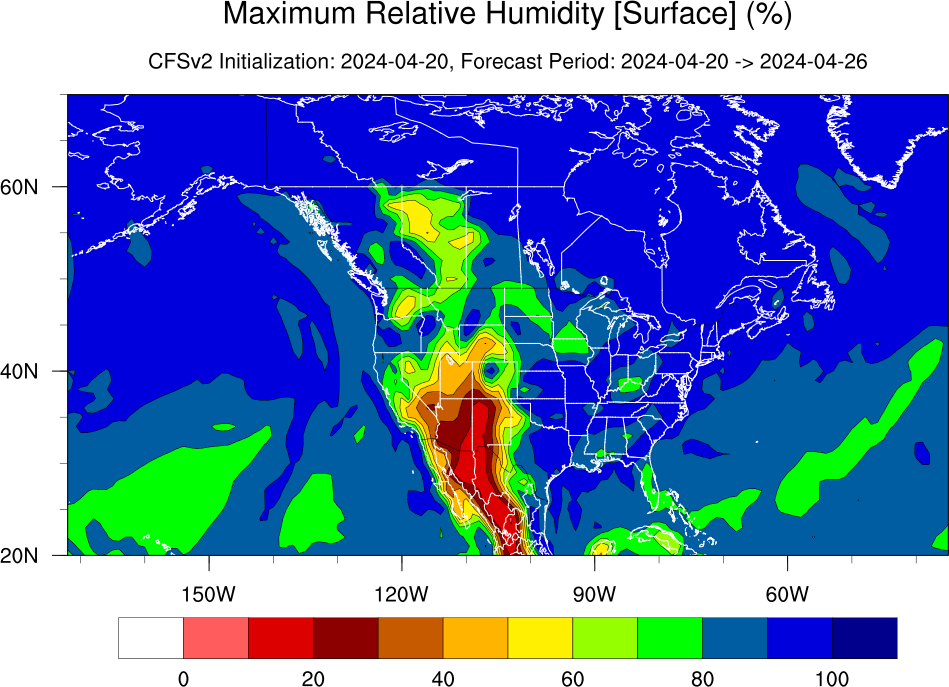
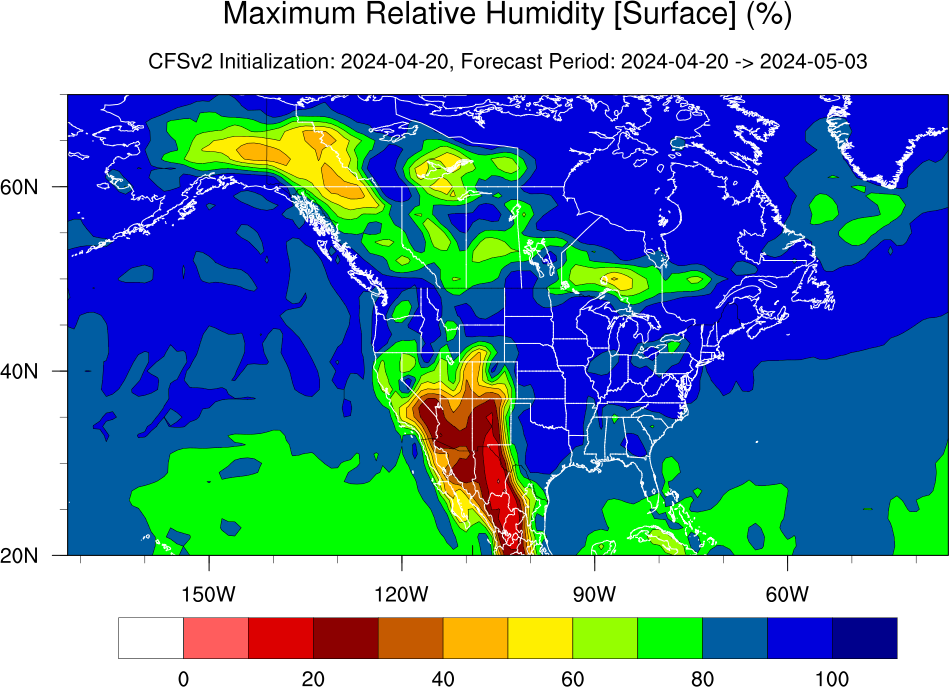
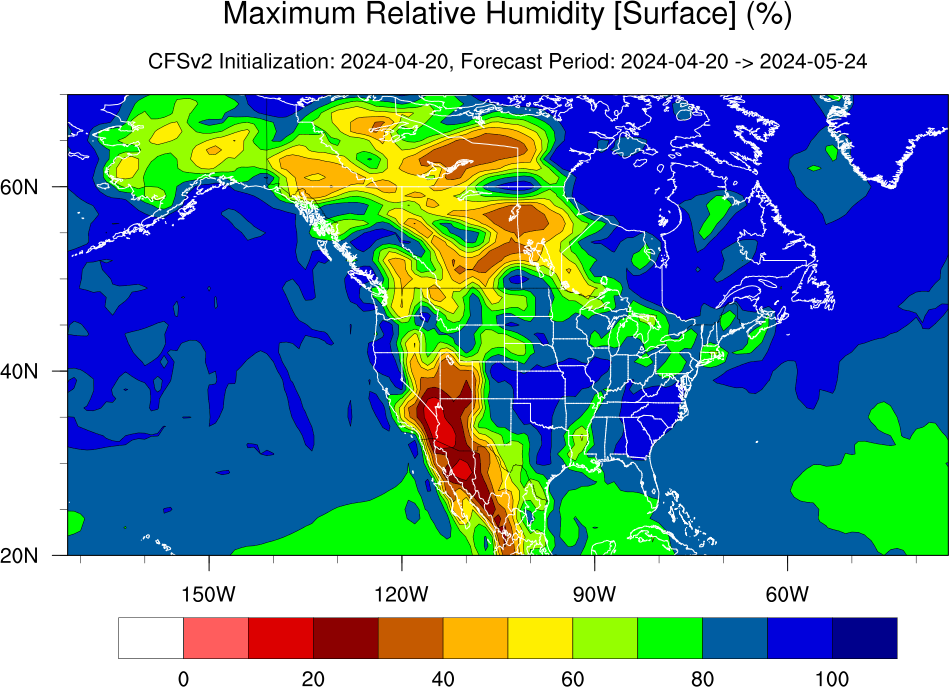
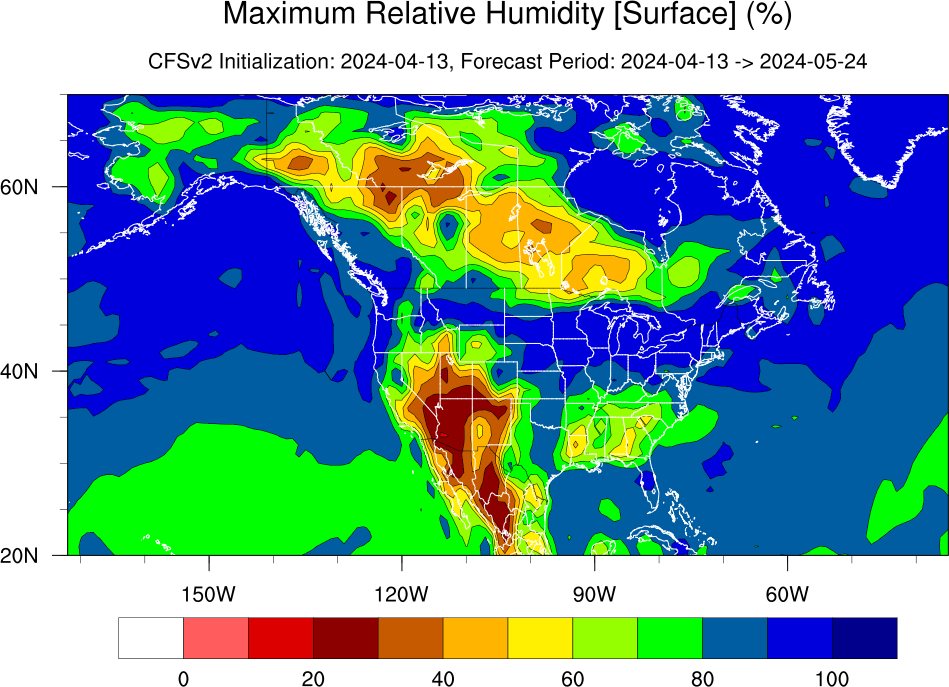
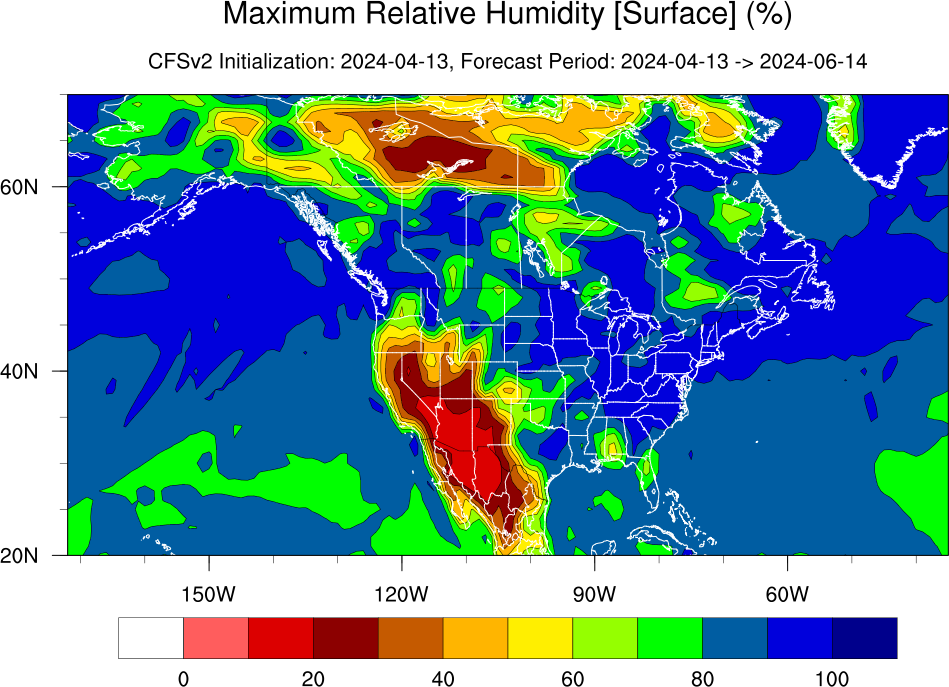
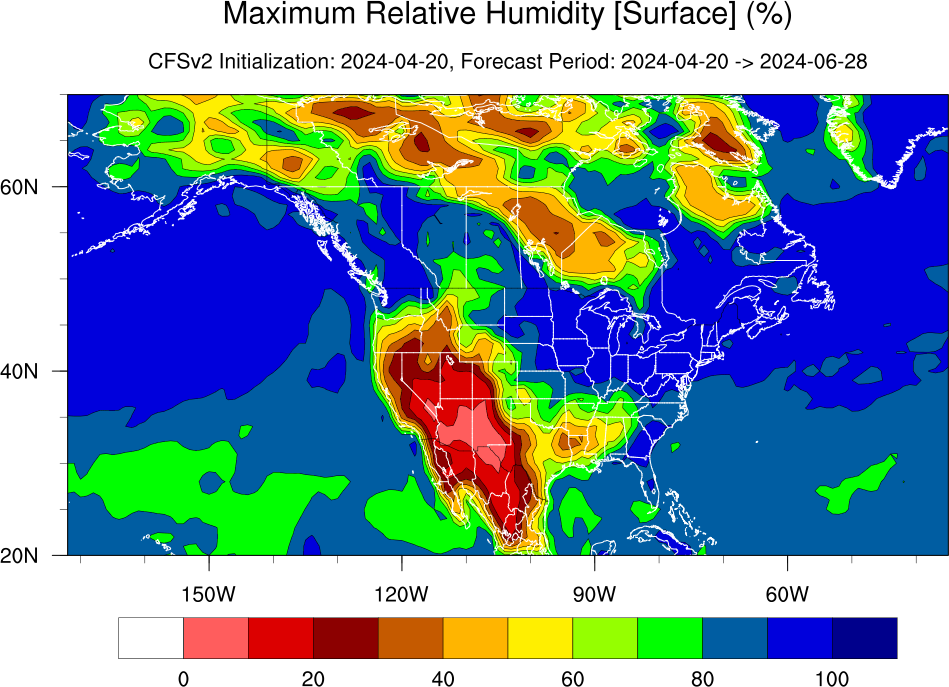
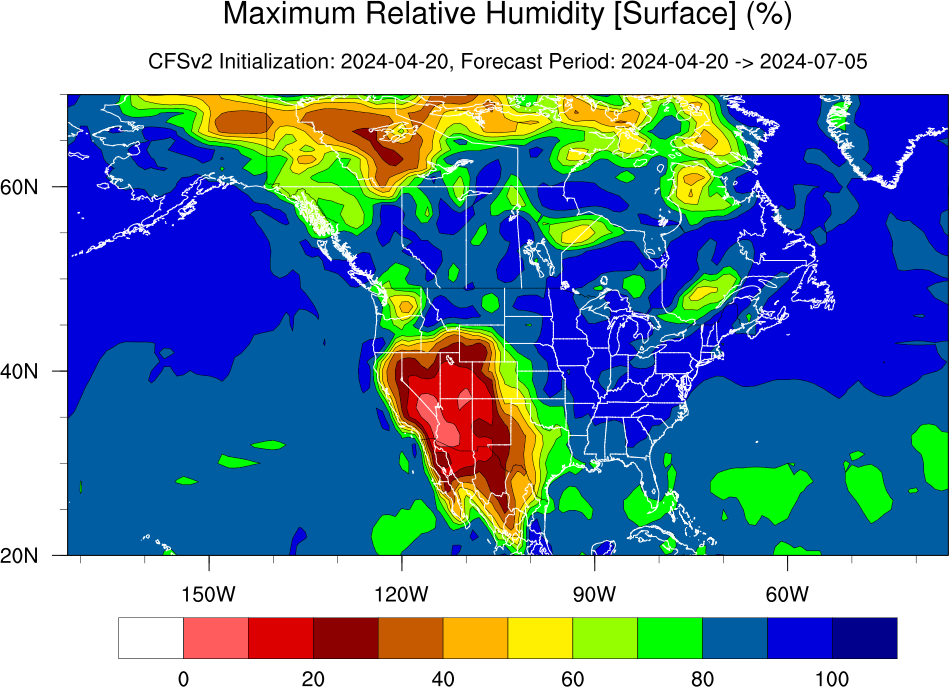
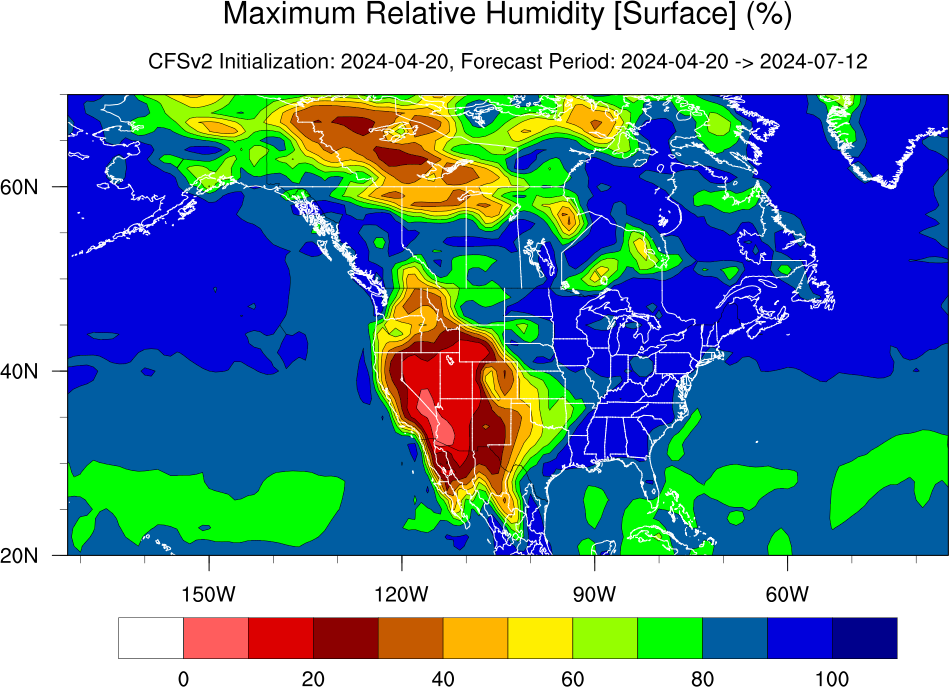
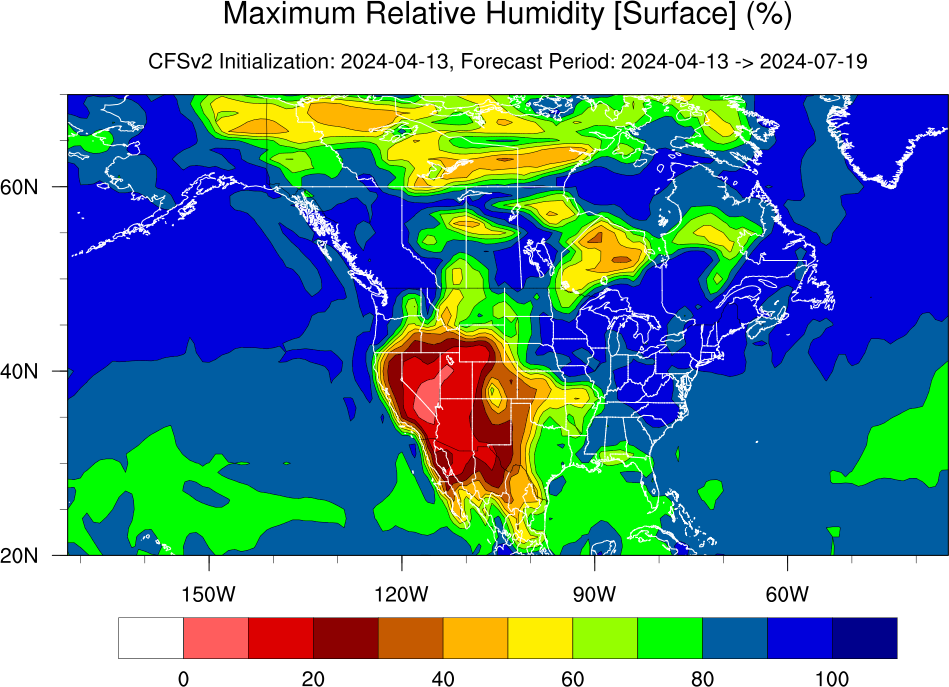
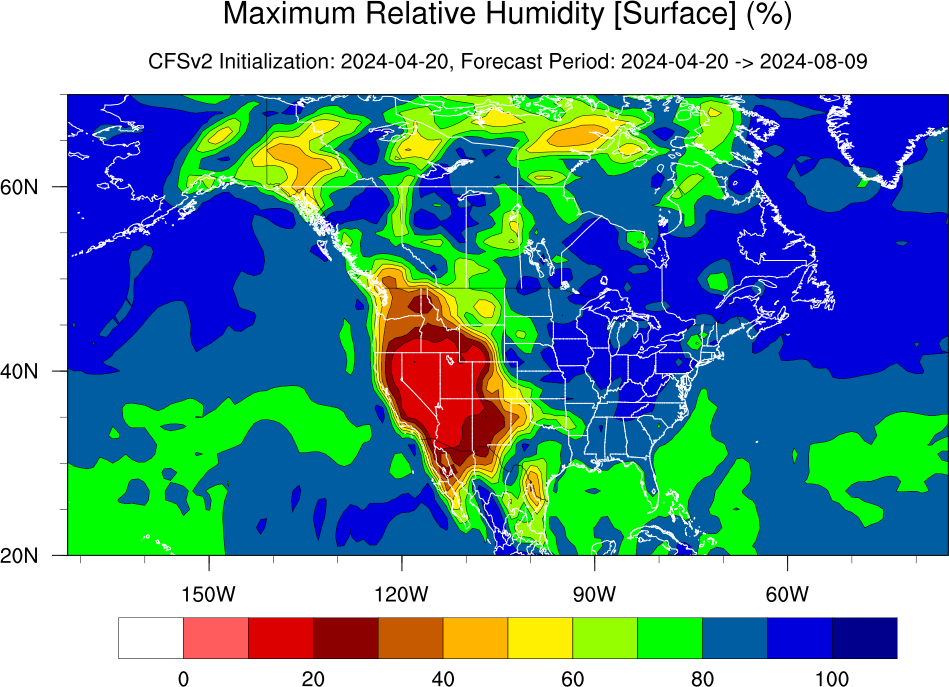
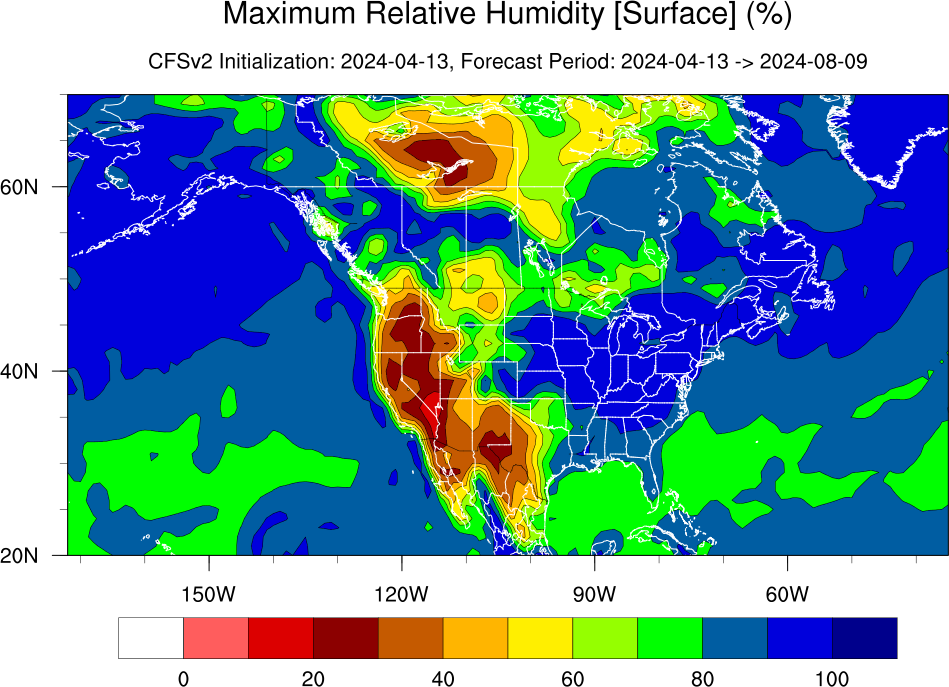
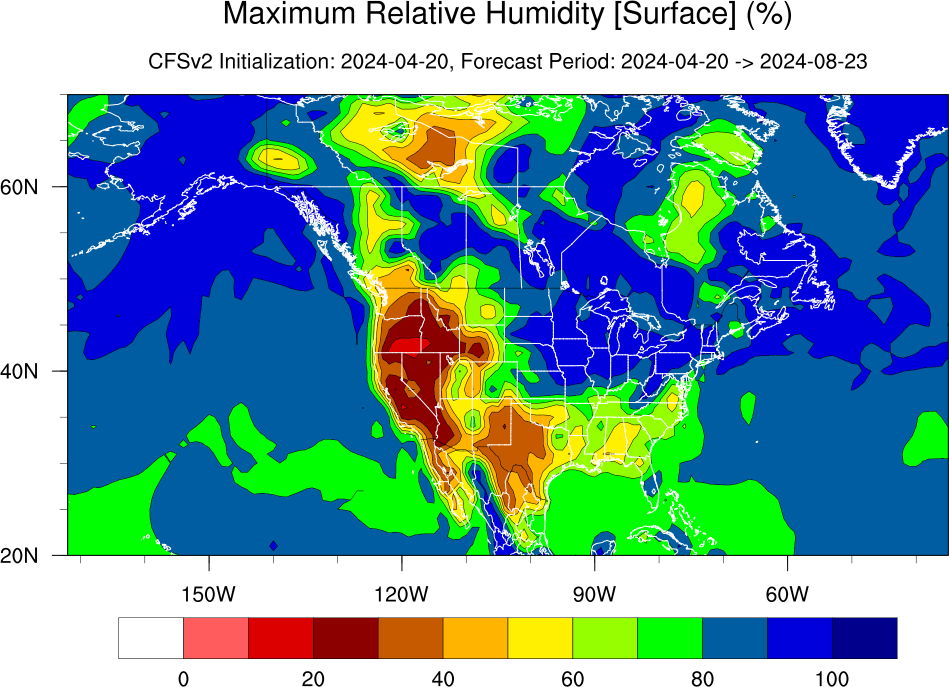
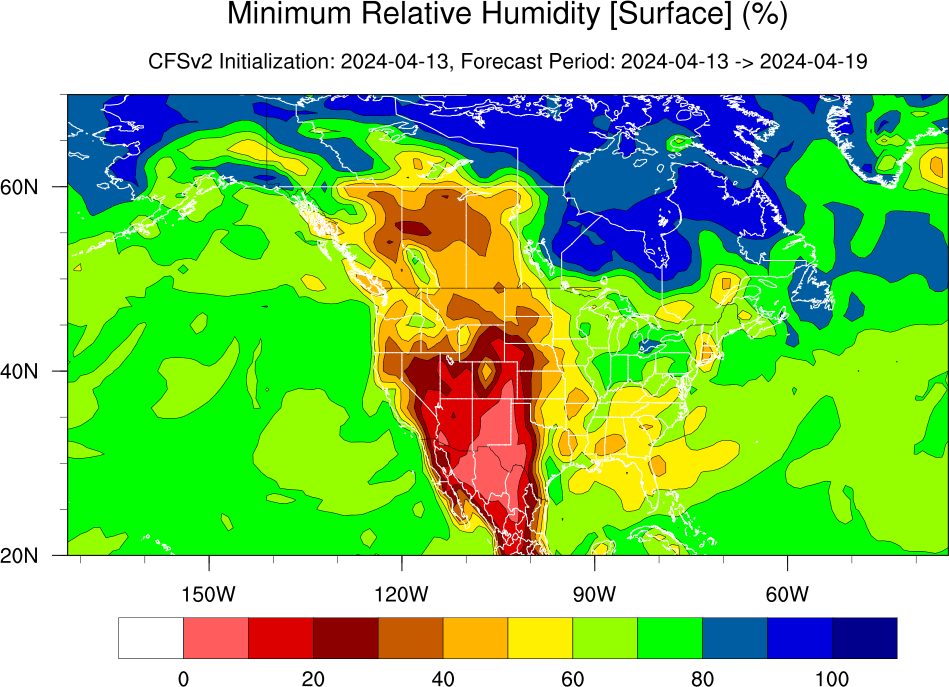
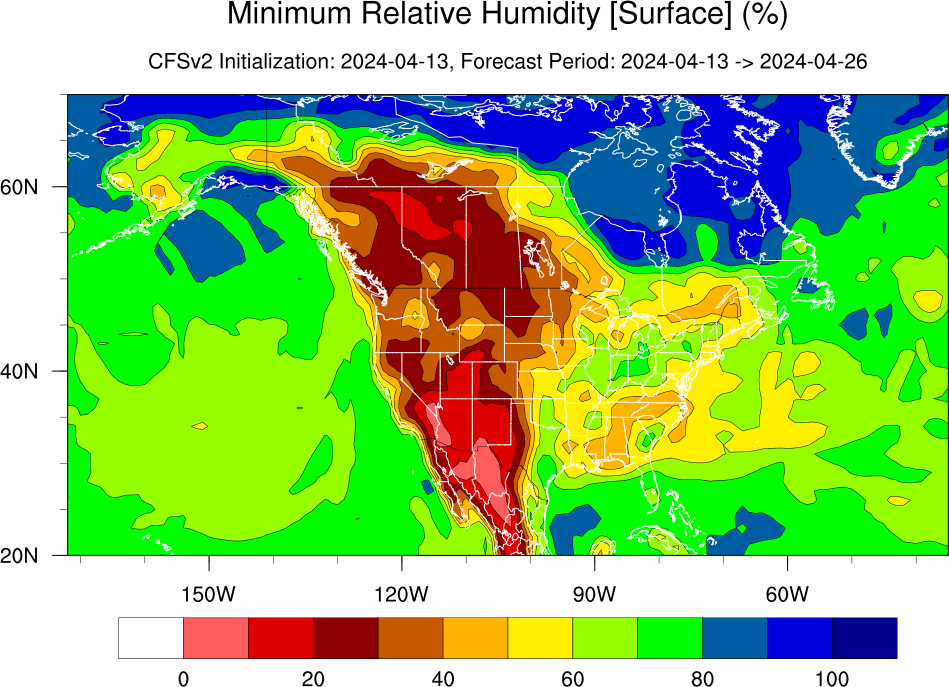
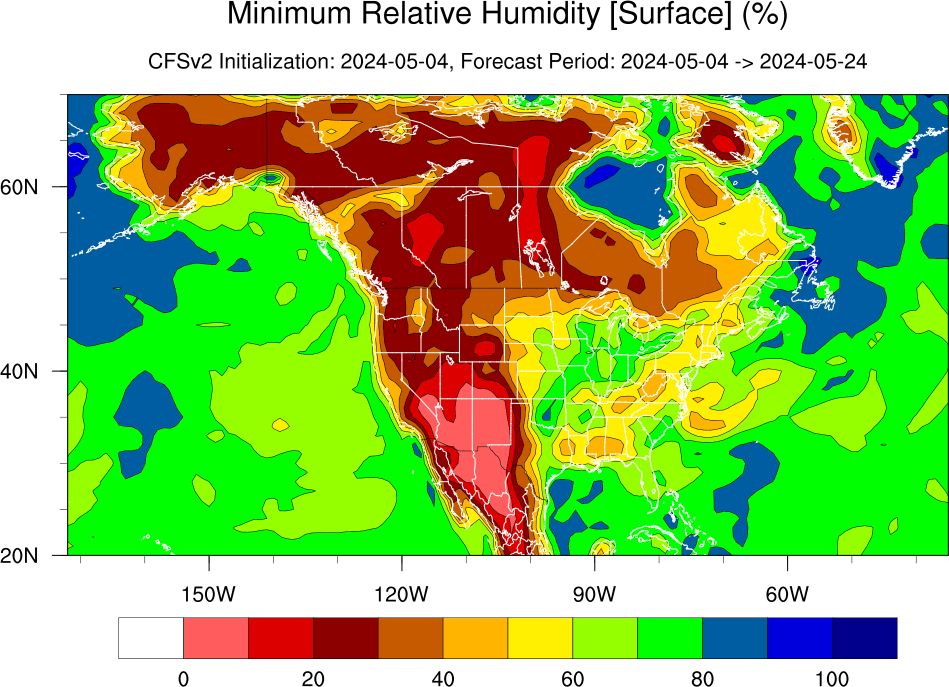
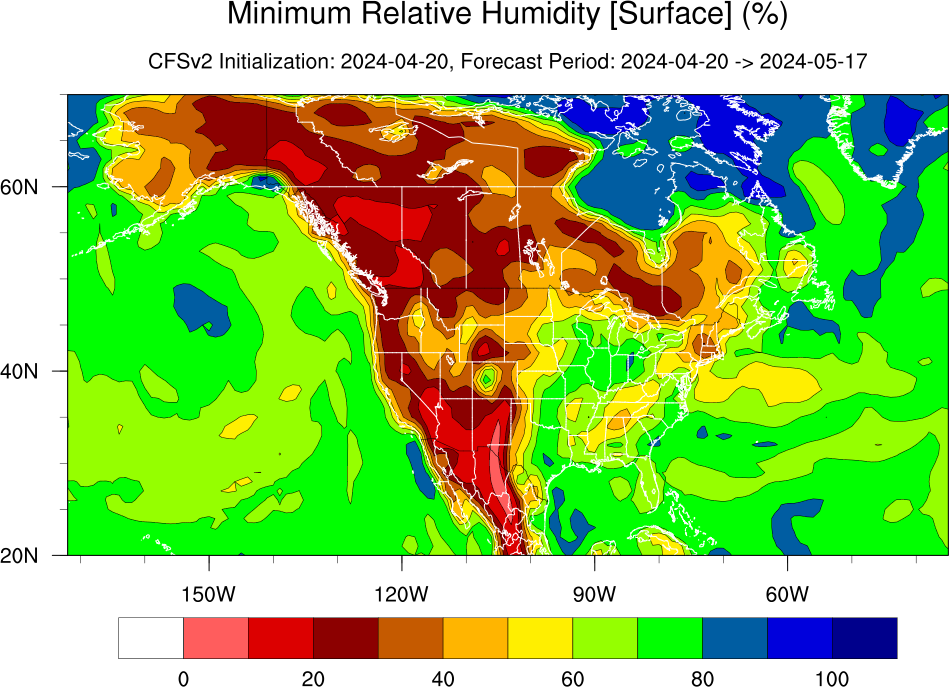
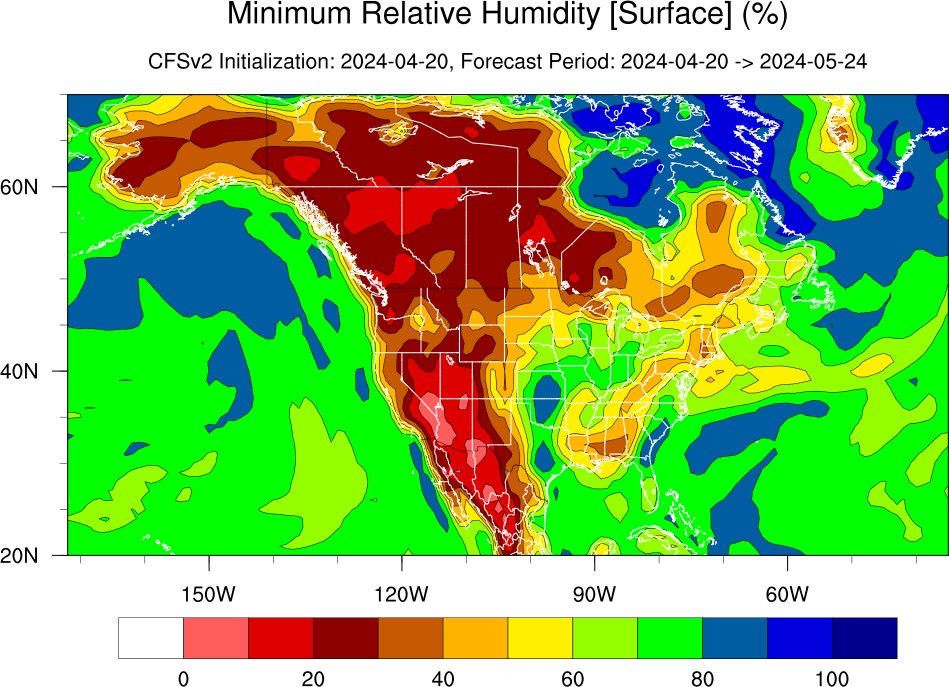
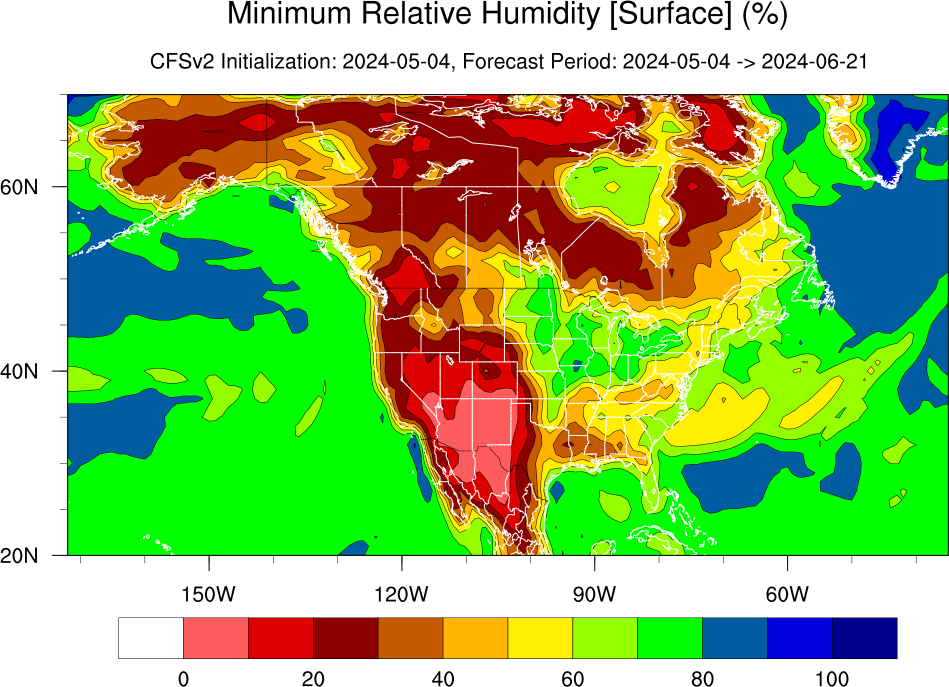
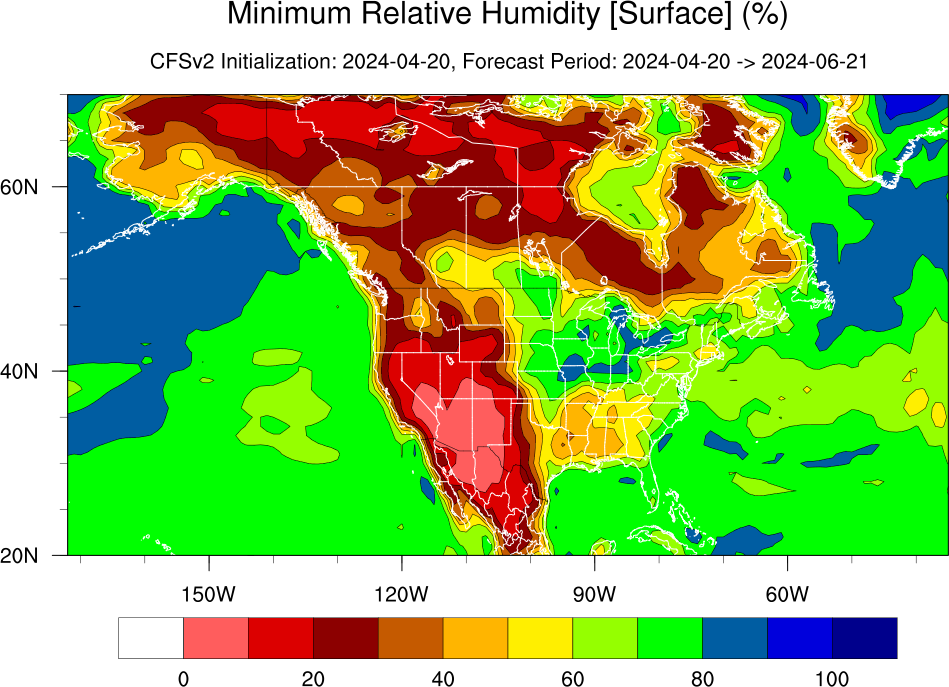
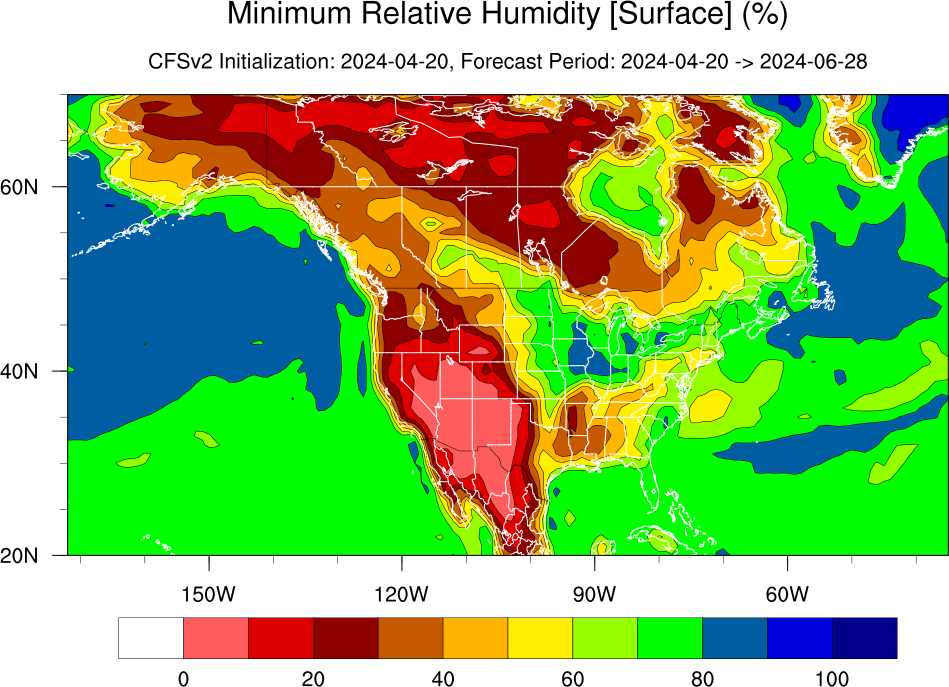
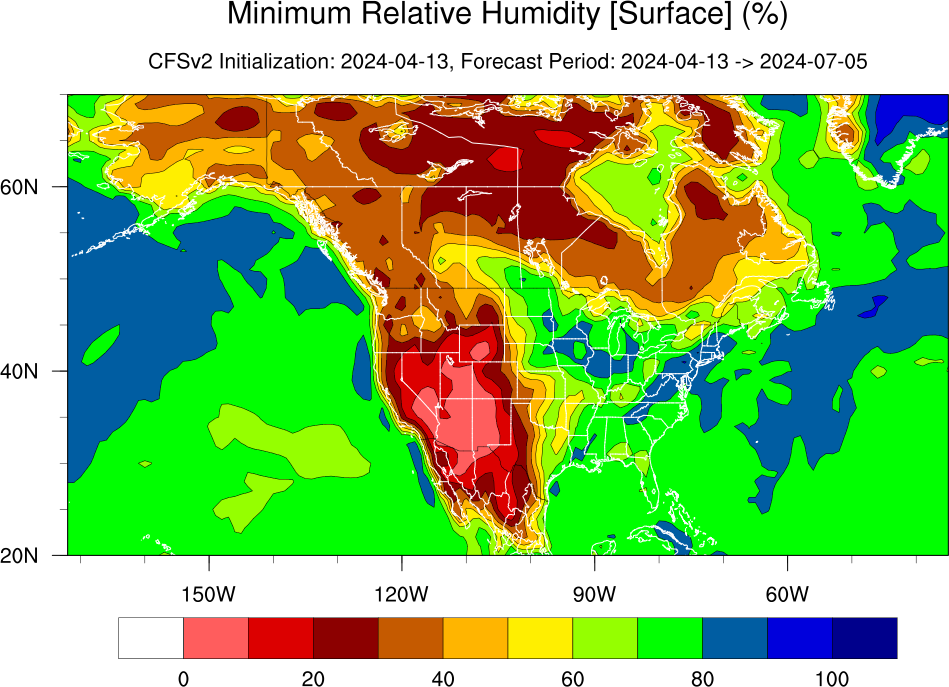
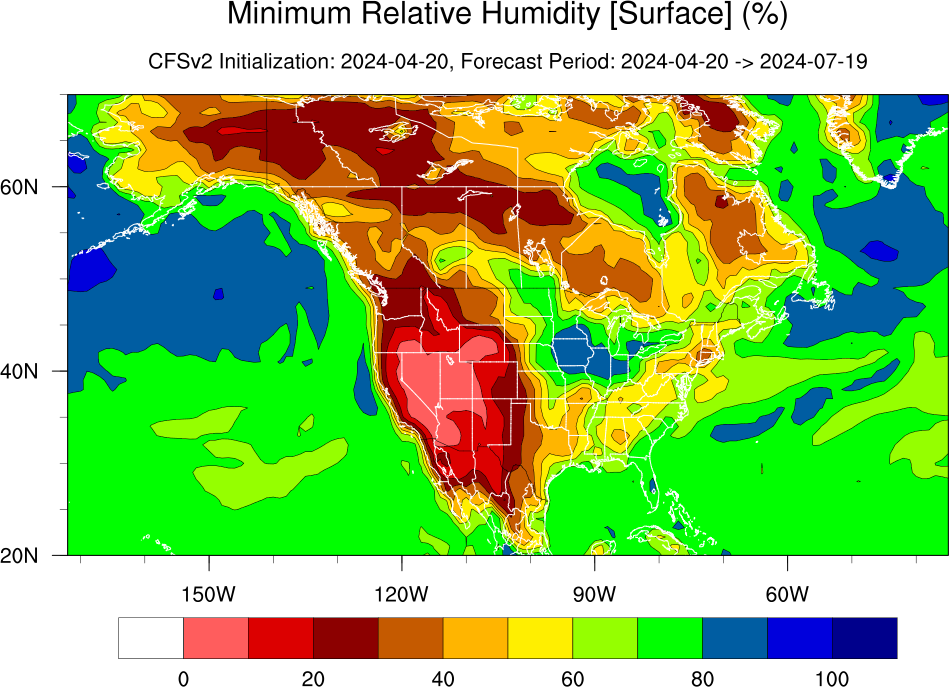
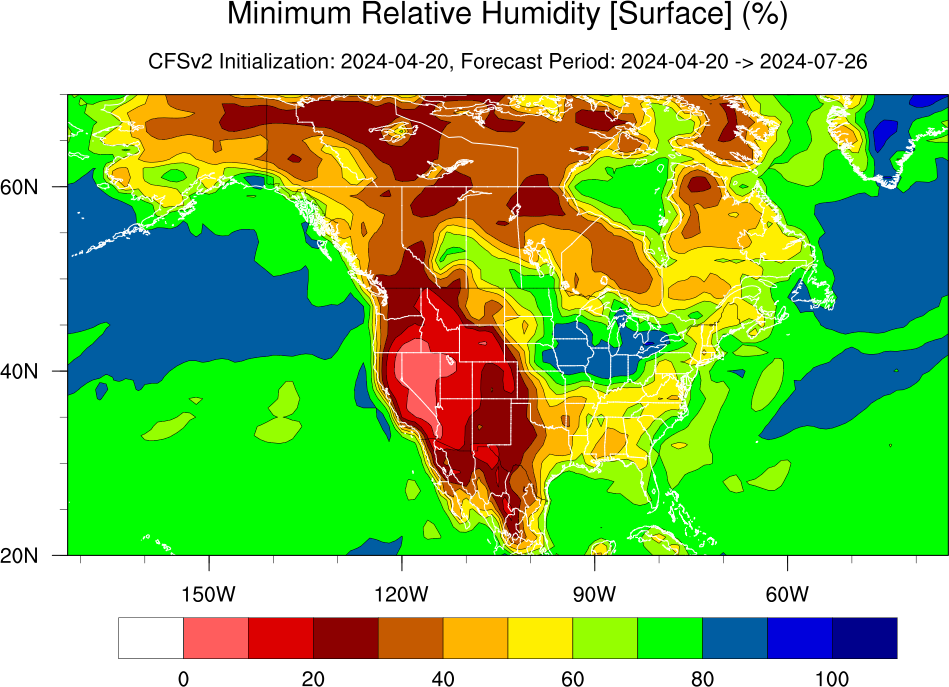
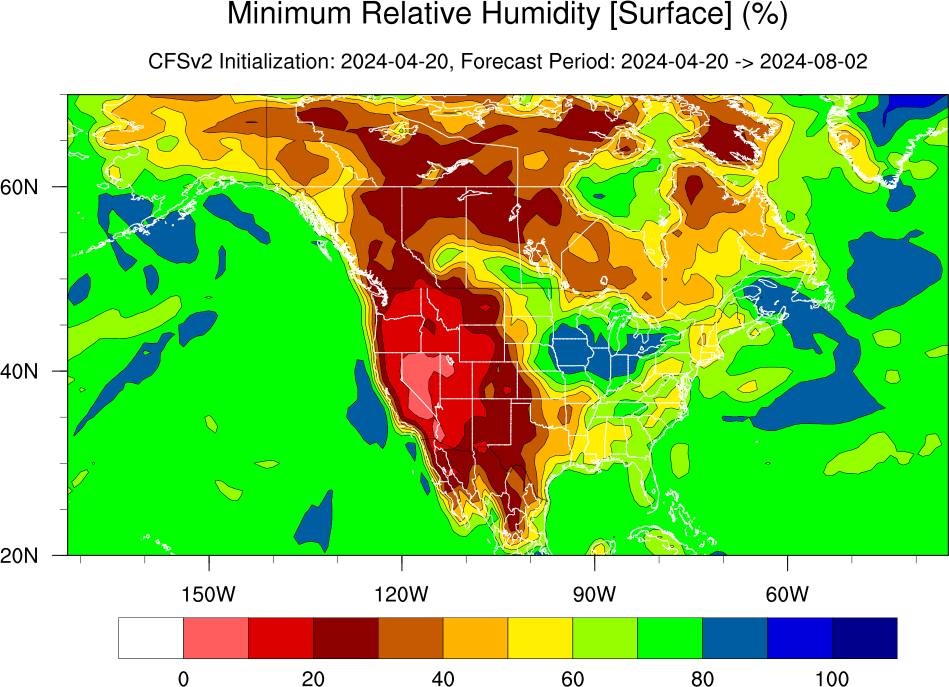
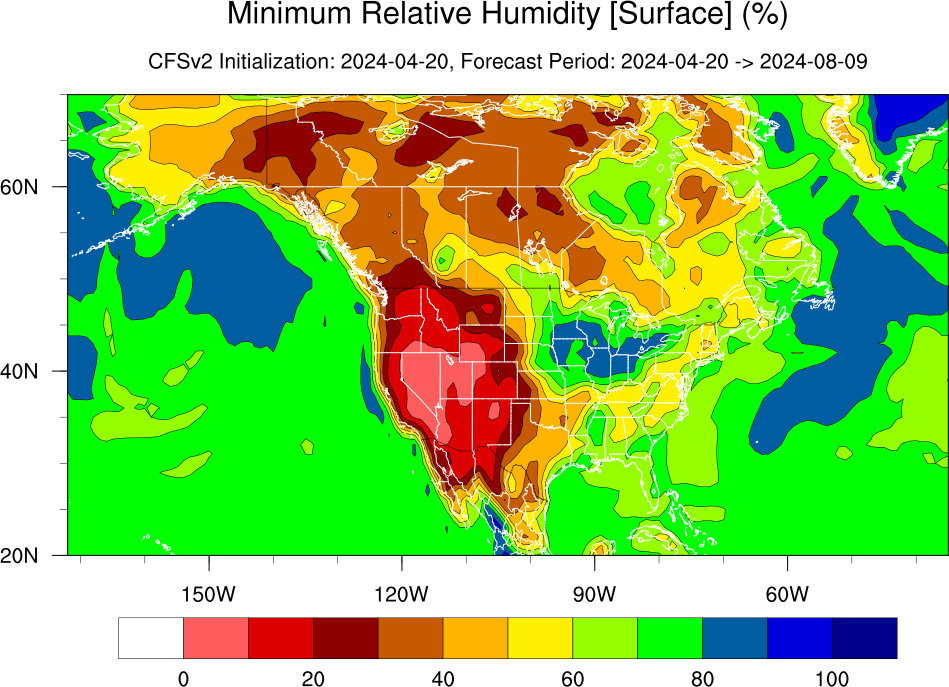
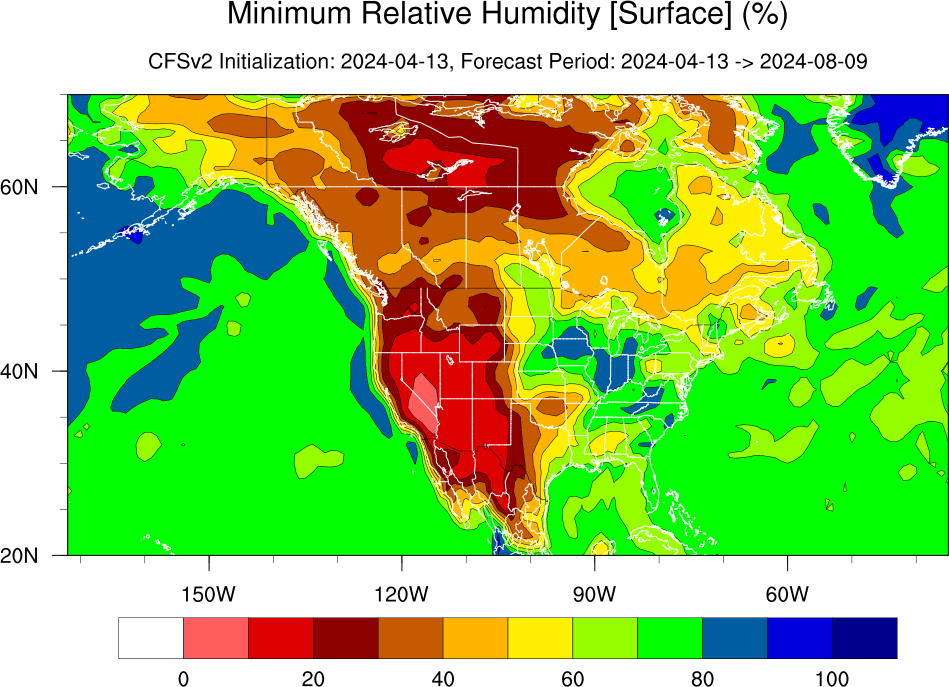
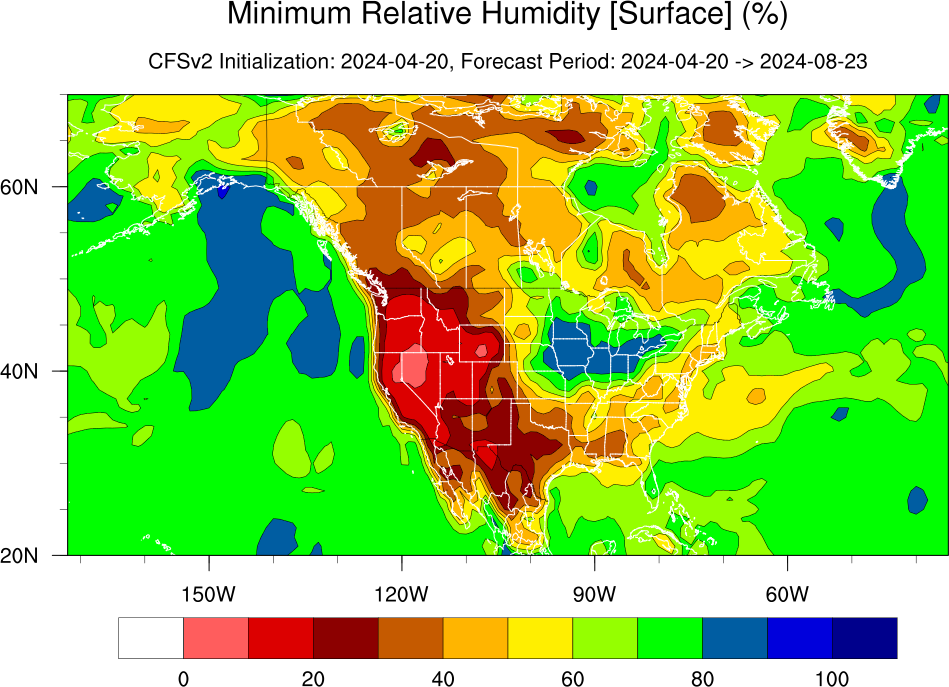
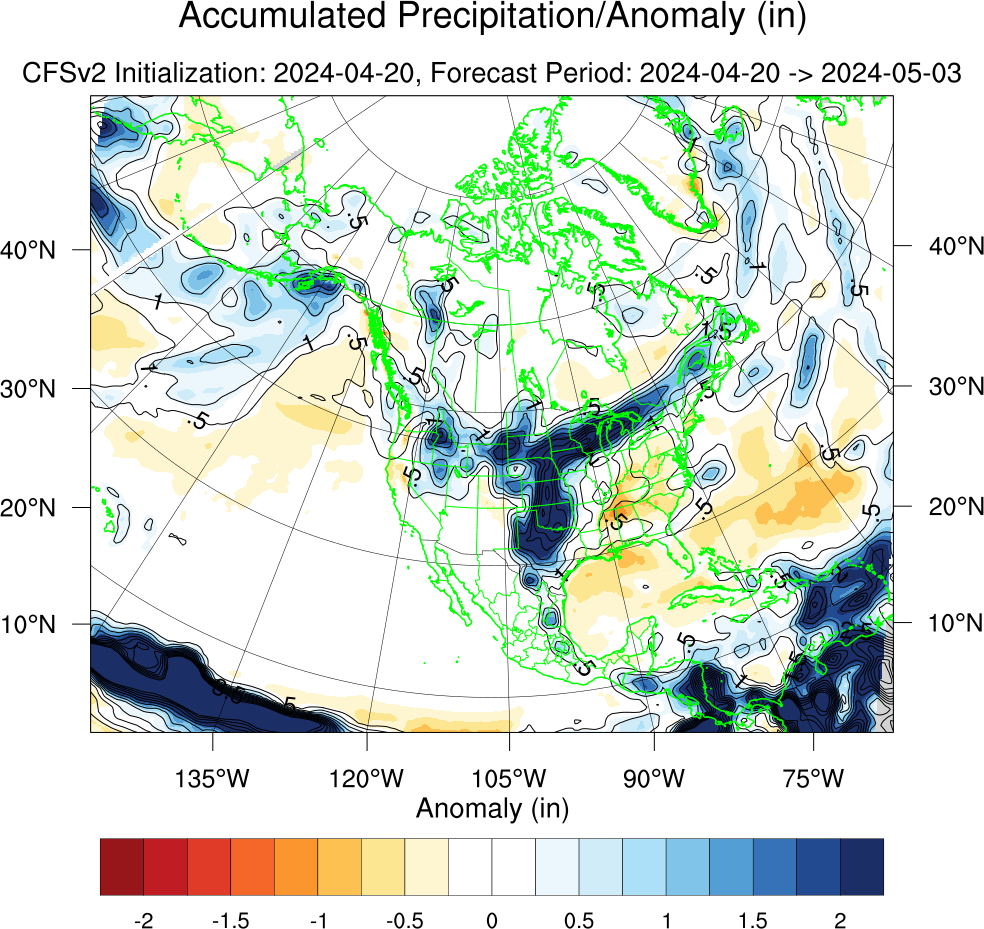
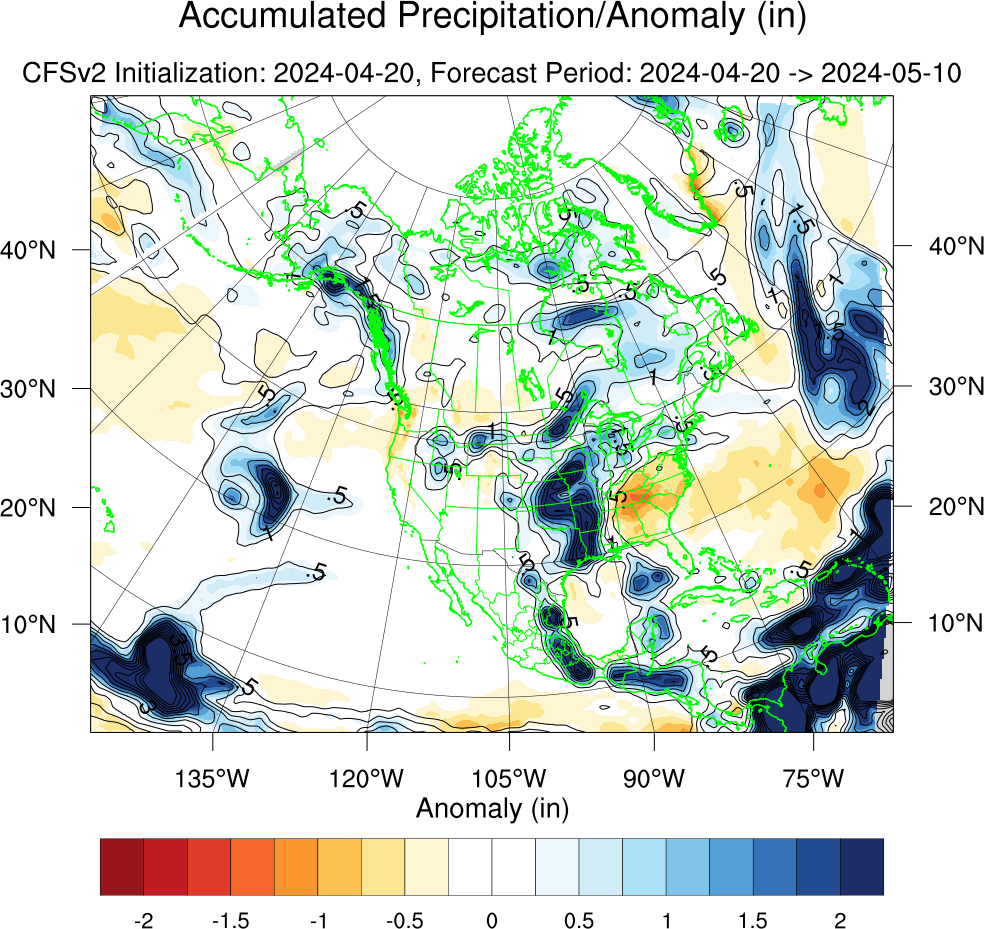
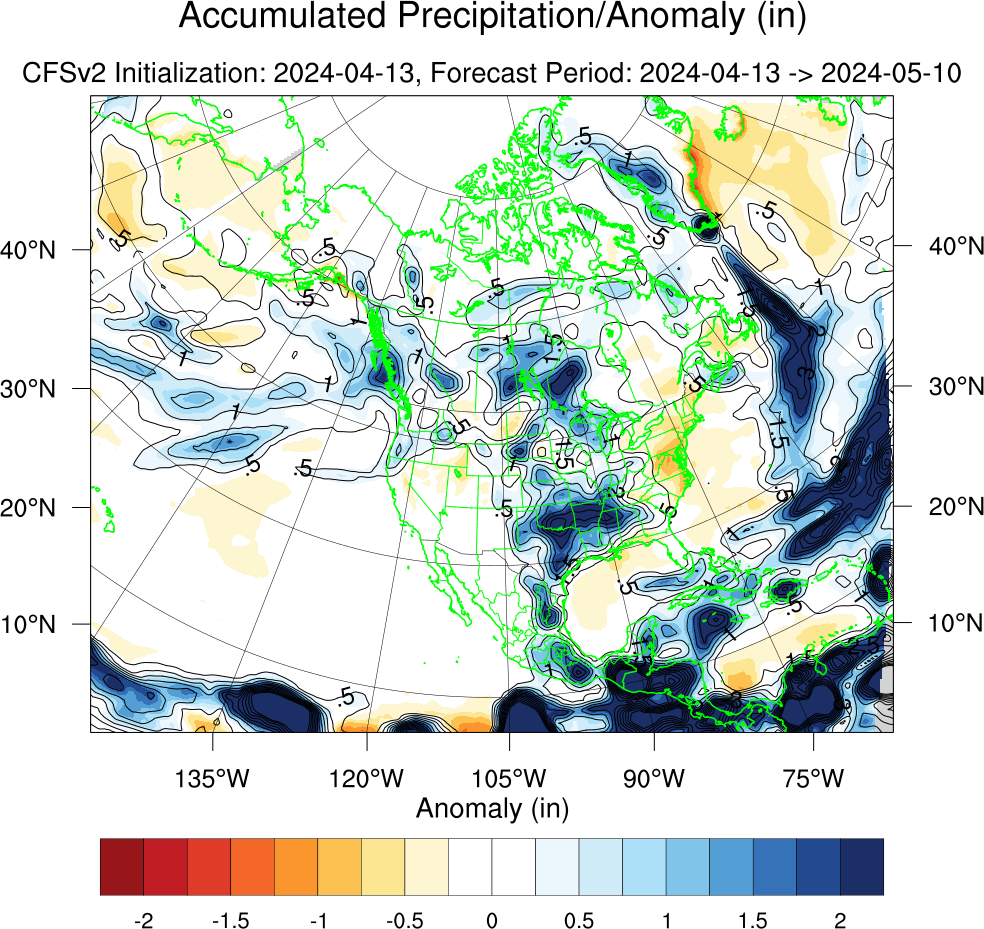
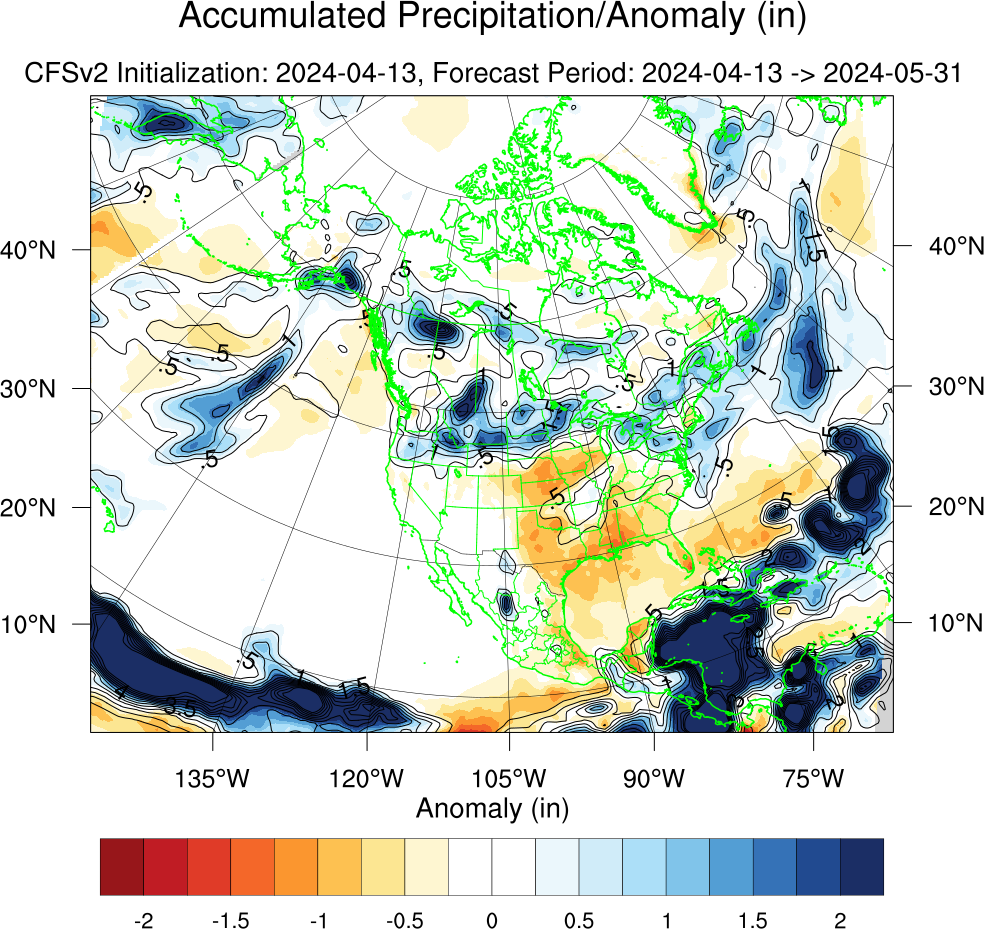
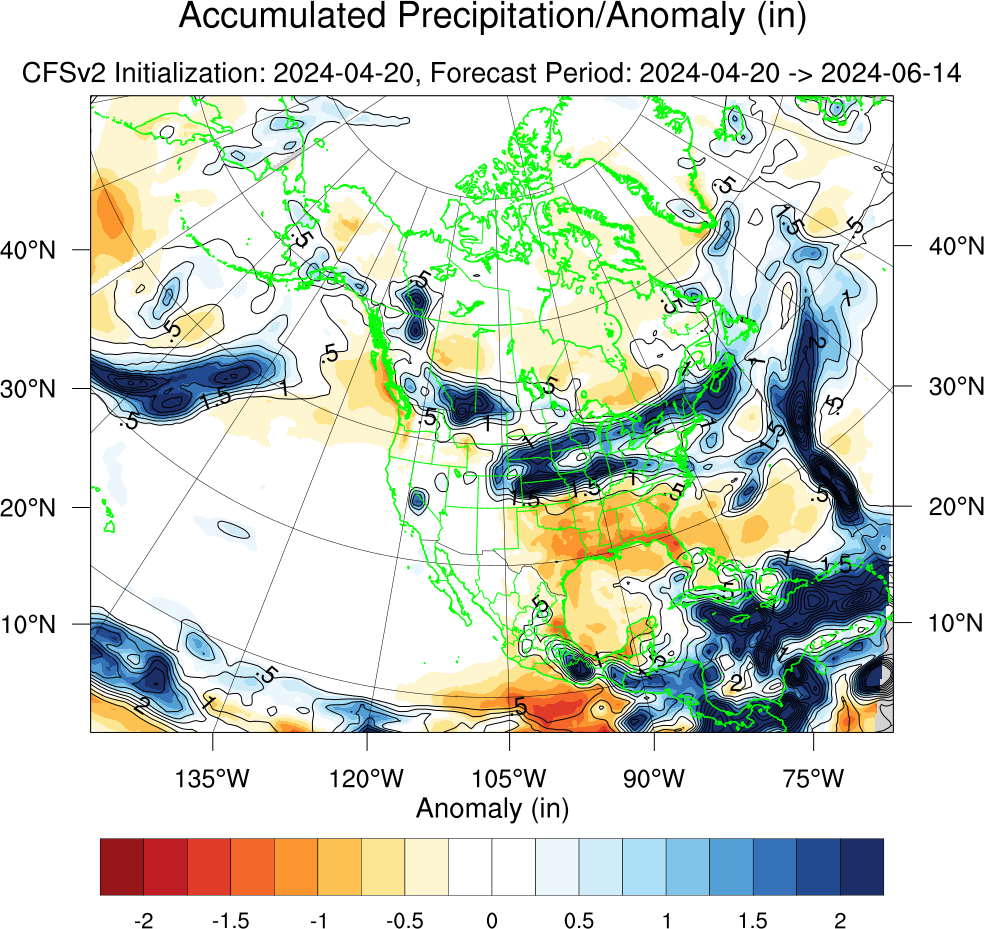
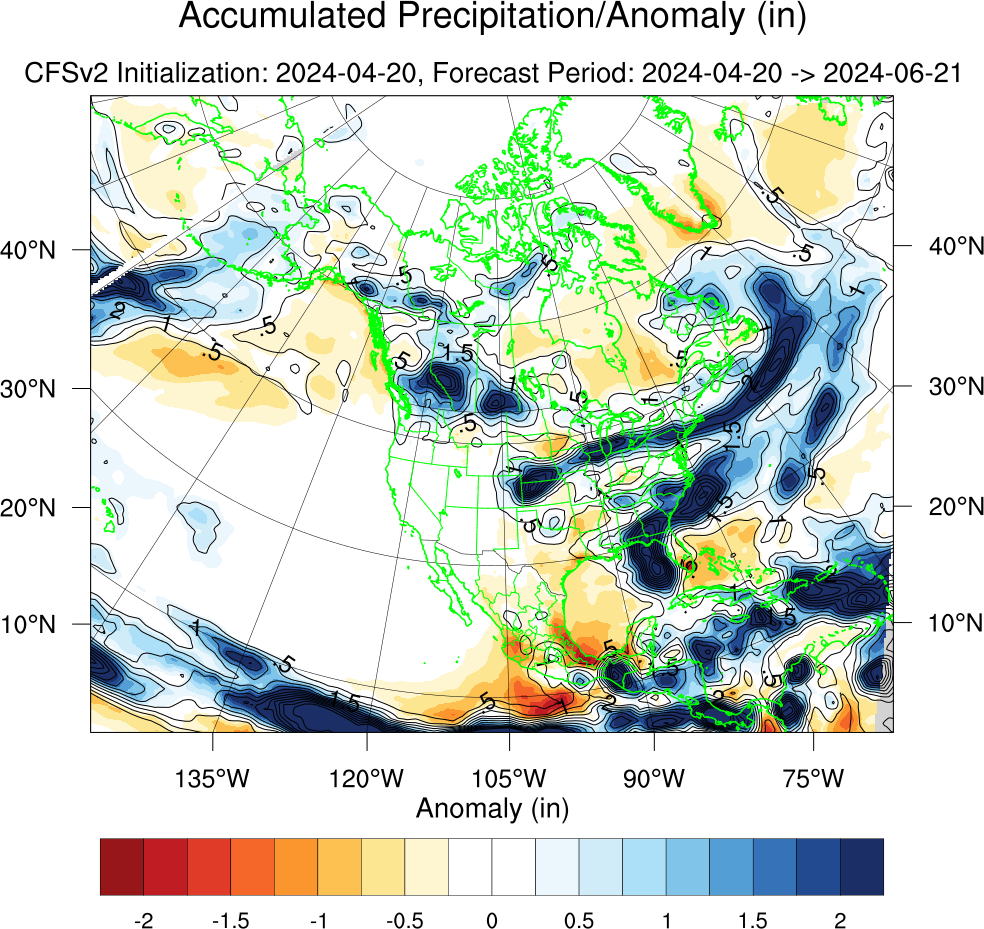
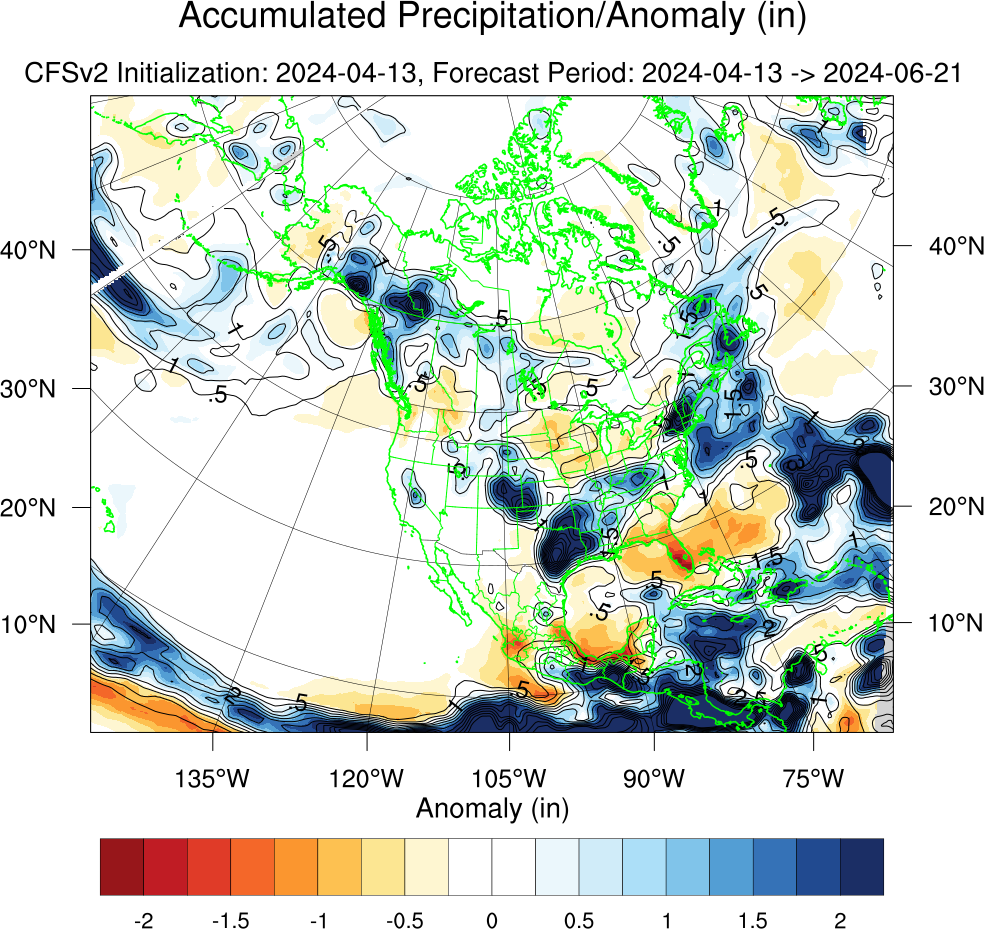
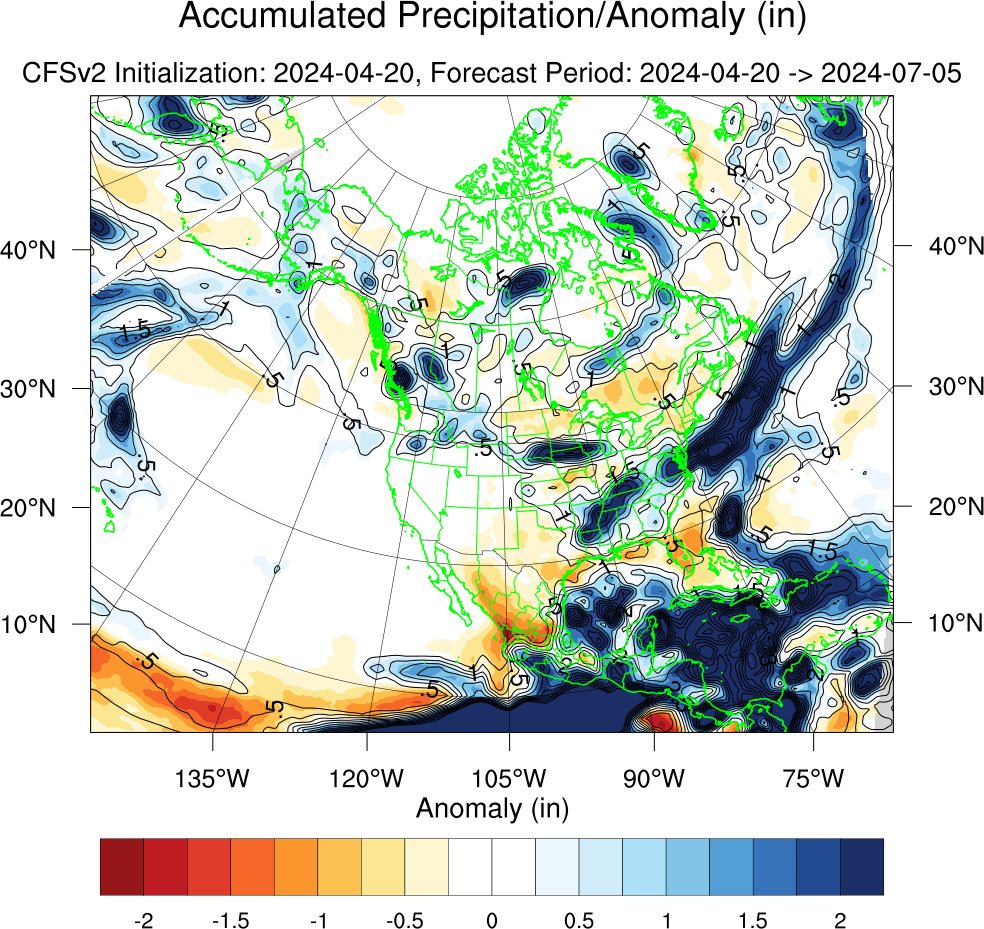
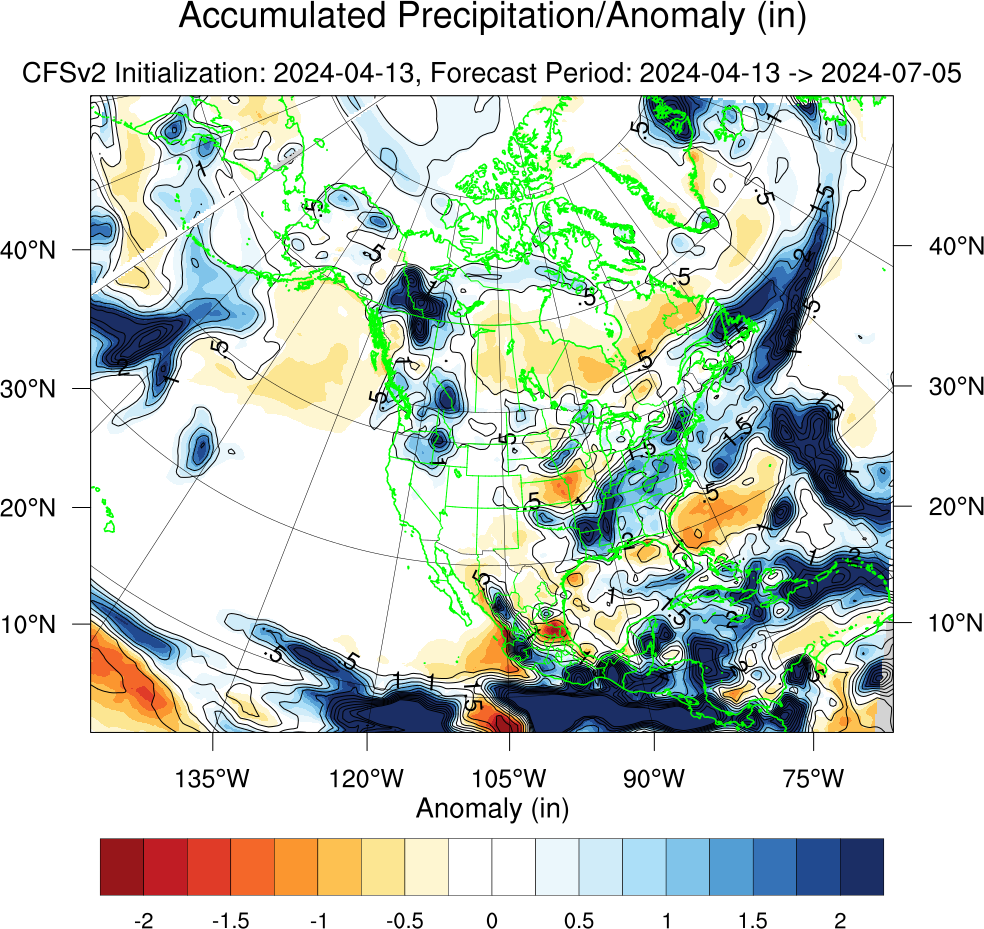
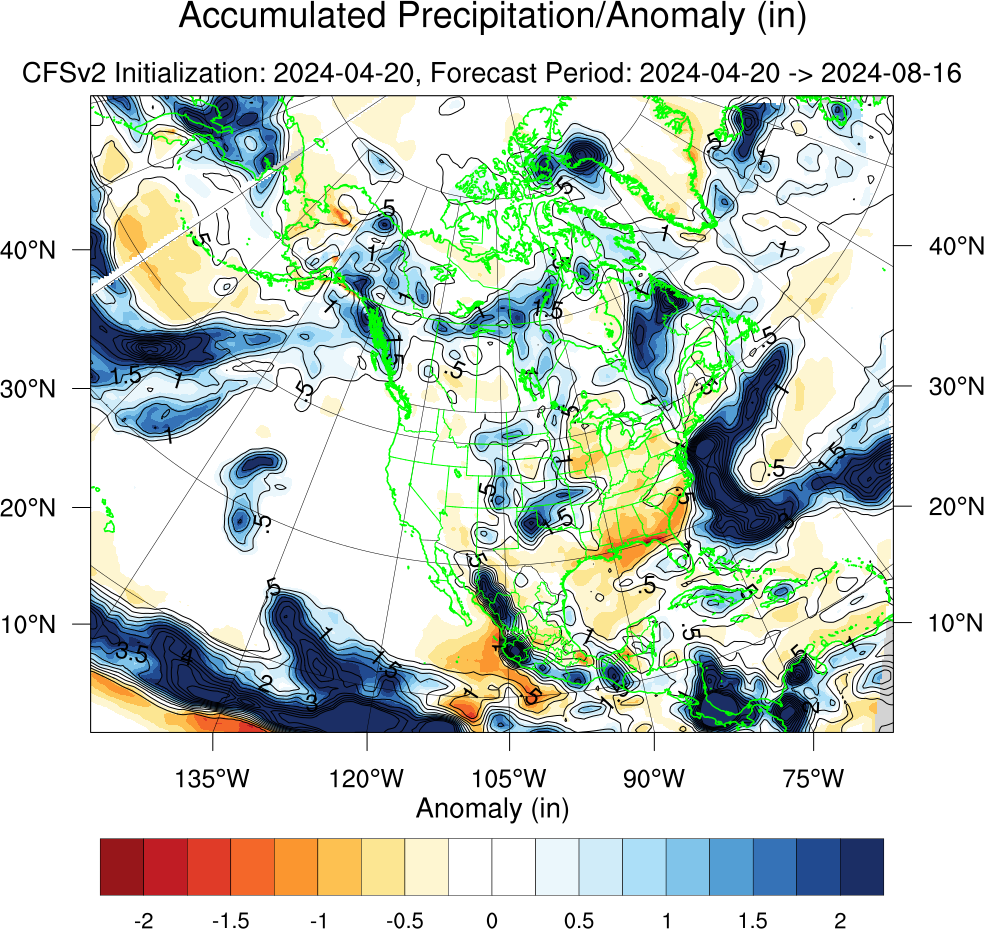
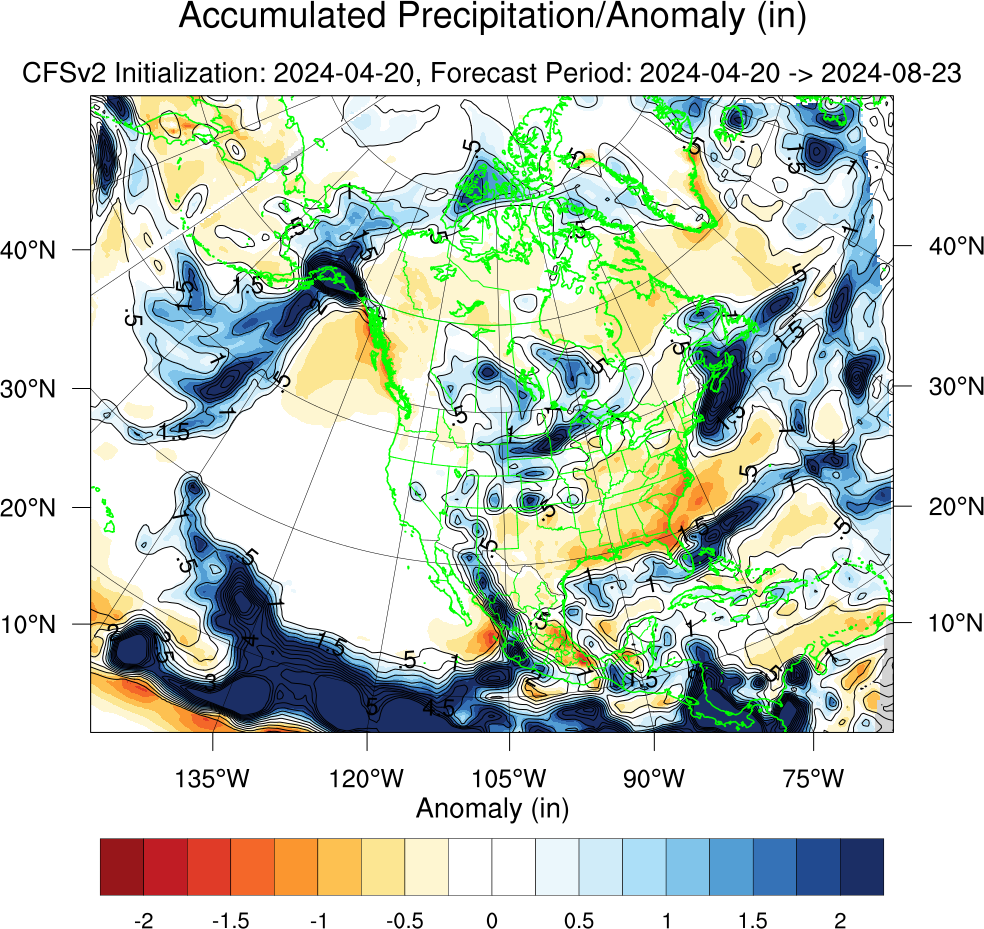
| This product has been developed to support Predictive Services wildland fire weekly to seasonal forecasts. Means, min/max relative humidity, and accumulated precipitation have been derived from the Climate Forecast System Version 2.0 (CFSv2) model single runs. Means represent the average at 00Z over 7 days; min/max relative humidity represents the average min/max at 00Z over 7 days; and accumulated precipitation represents the total over all daily times steps (00/06/12/18 Z) over 7 days. Anomalies are derived using 30-year daily climatologies [1981-2010] computed from the NCEP North American Regional Reanalysis (NARR) and the Global Reanalysis I datasets. Vector maps show values for every other grid cell. Global maps are updated once per month on the 20th and North American maps are updated on each Sunday of the month. |