ACIS Precipitation: 2026/04/28
| Map | All Periods | Last 7 days | Last 30 days | Last 60 days | Last Full Month |
|---|---|---|---|---|---|
| North America Percentile | Grid | last7 | last30 | last60 | lastfull |
| North America Accumulated | Grid | last7 | last30 | last60 | lastfull |
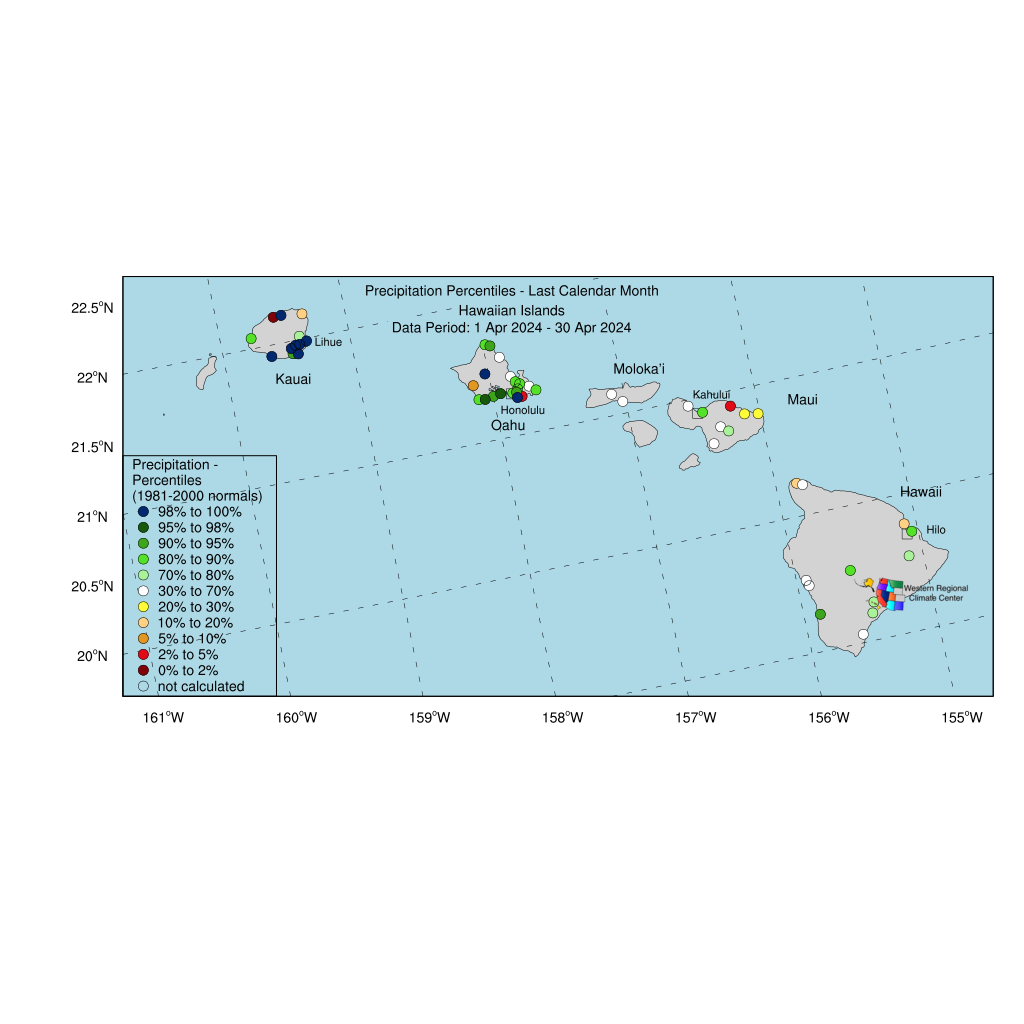
| Hawaiian Islands Percentile | Grid | last7 | last30 | last60 | lastfull |
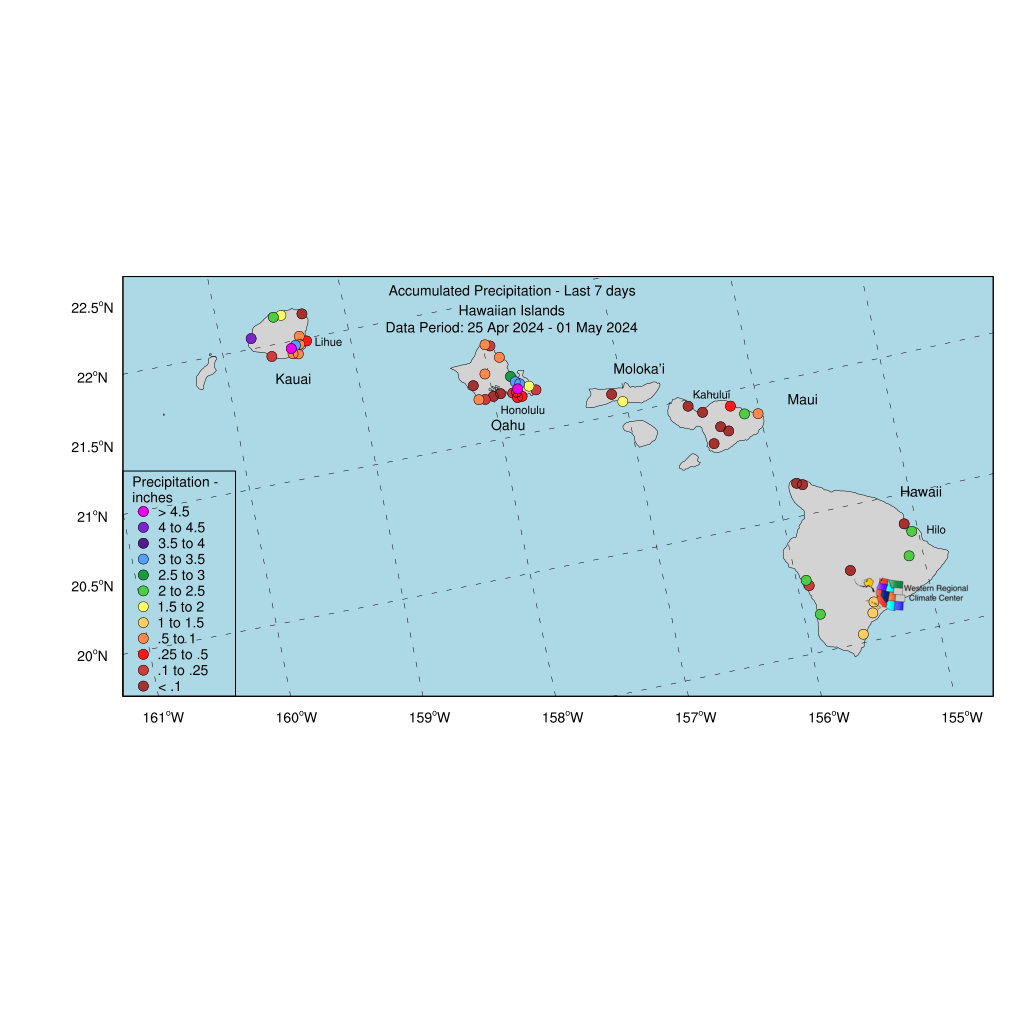
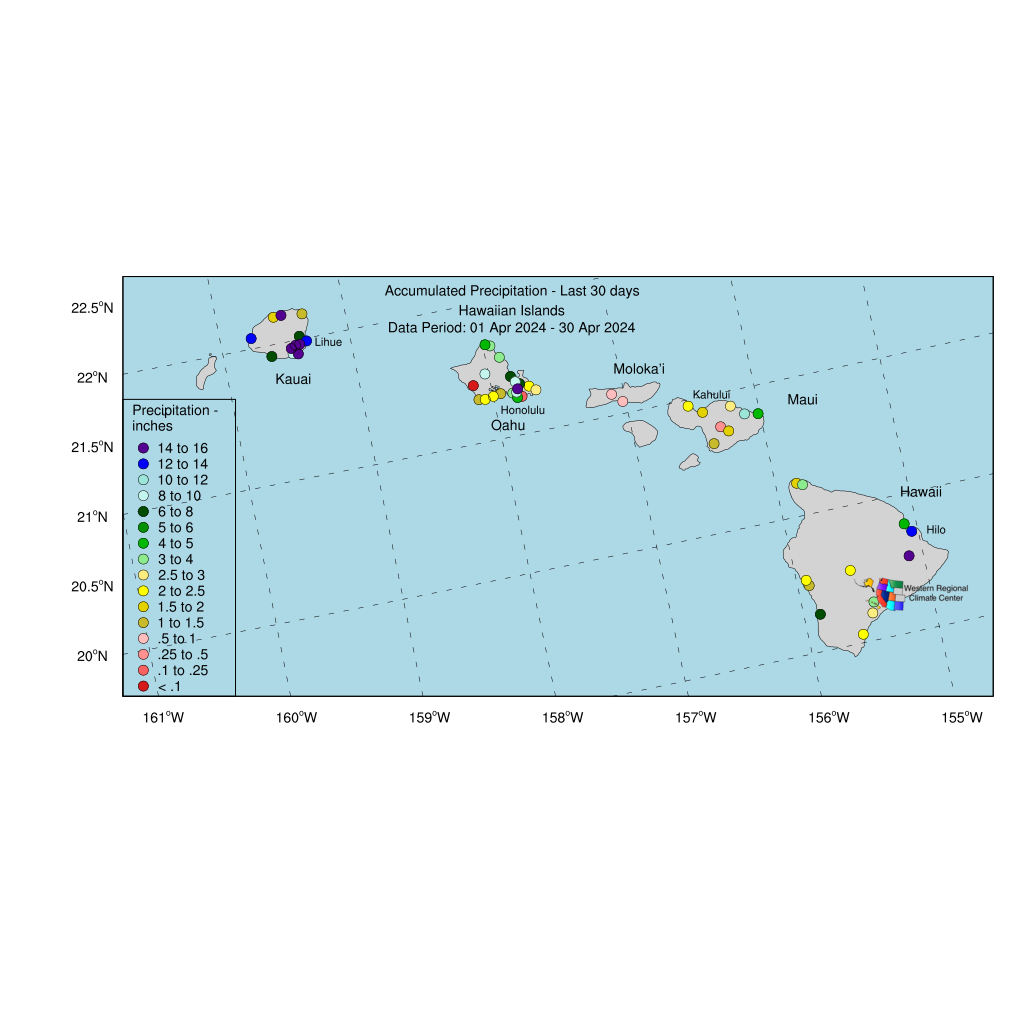
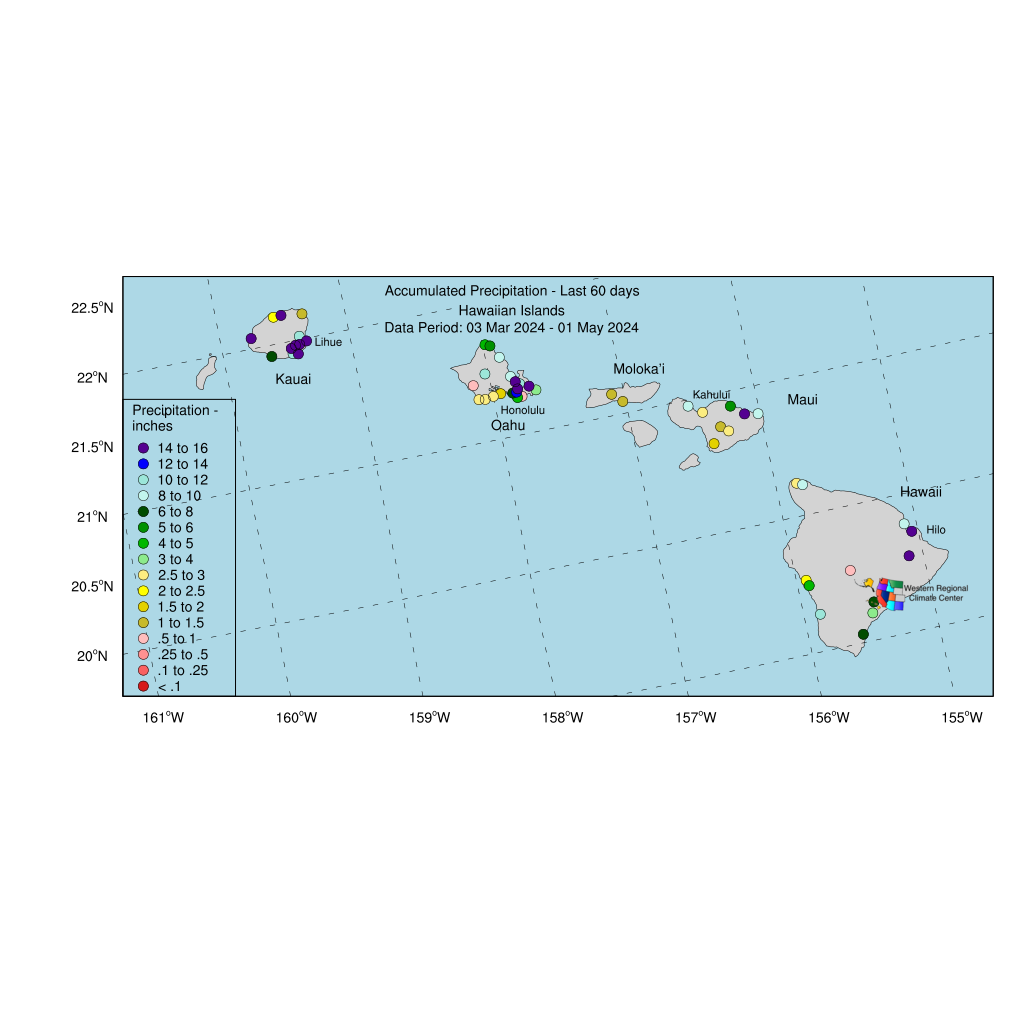
| Hawaiian Islands Accumulated | Grid | last7 | last30 | last60 | lastfull |
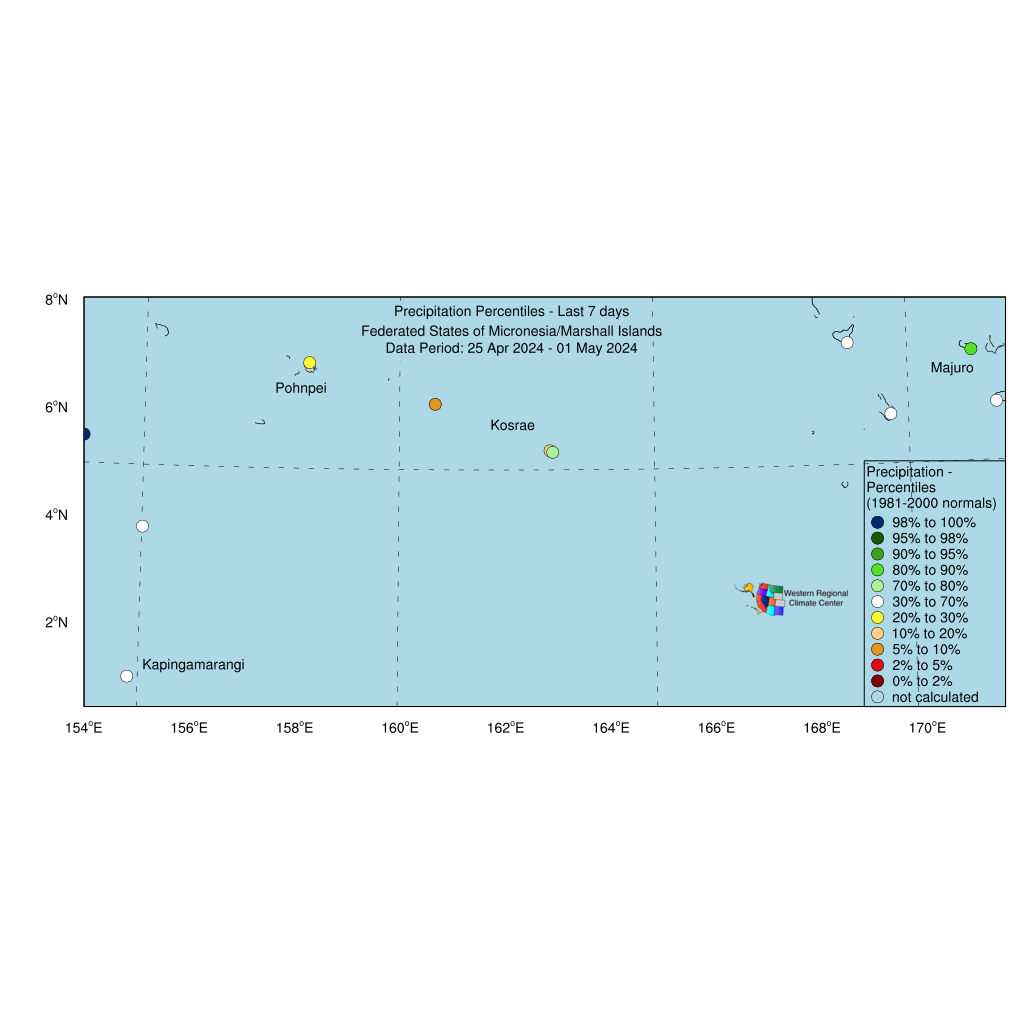
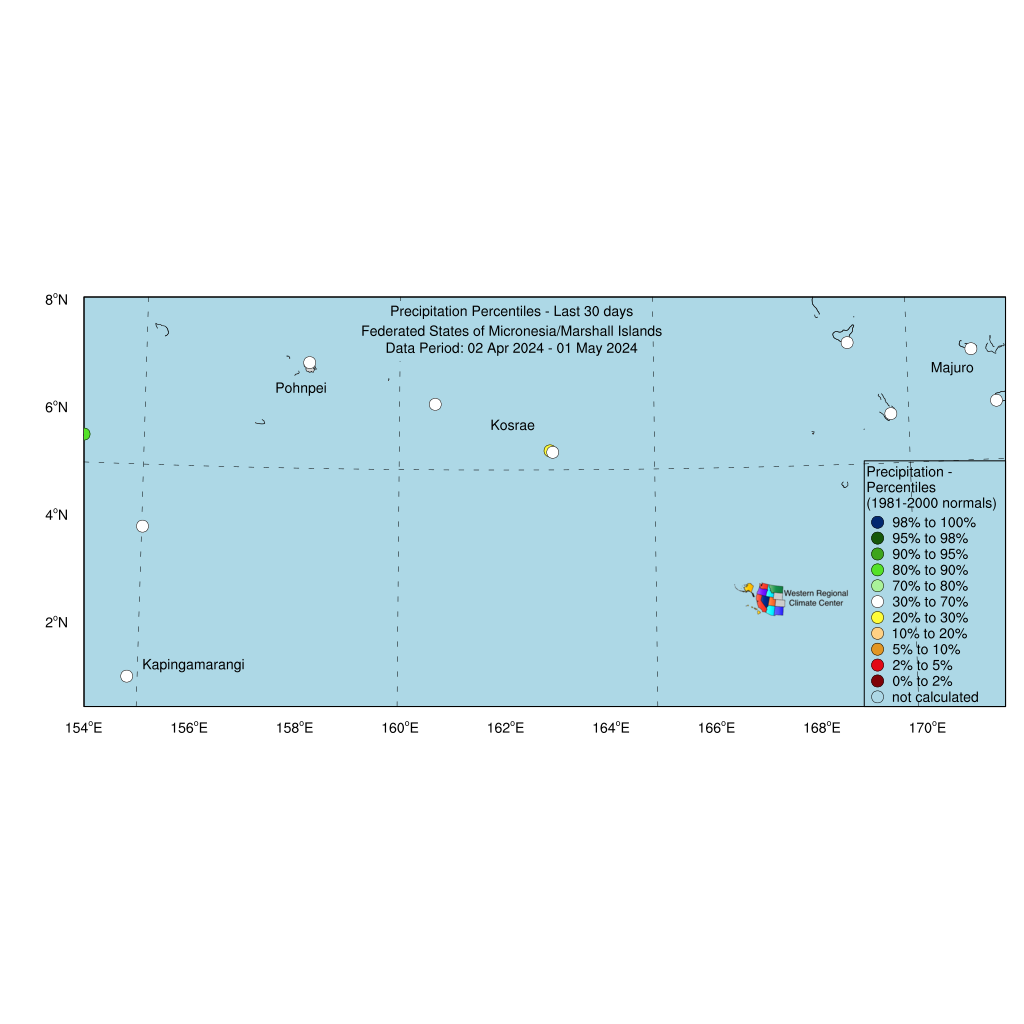
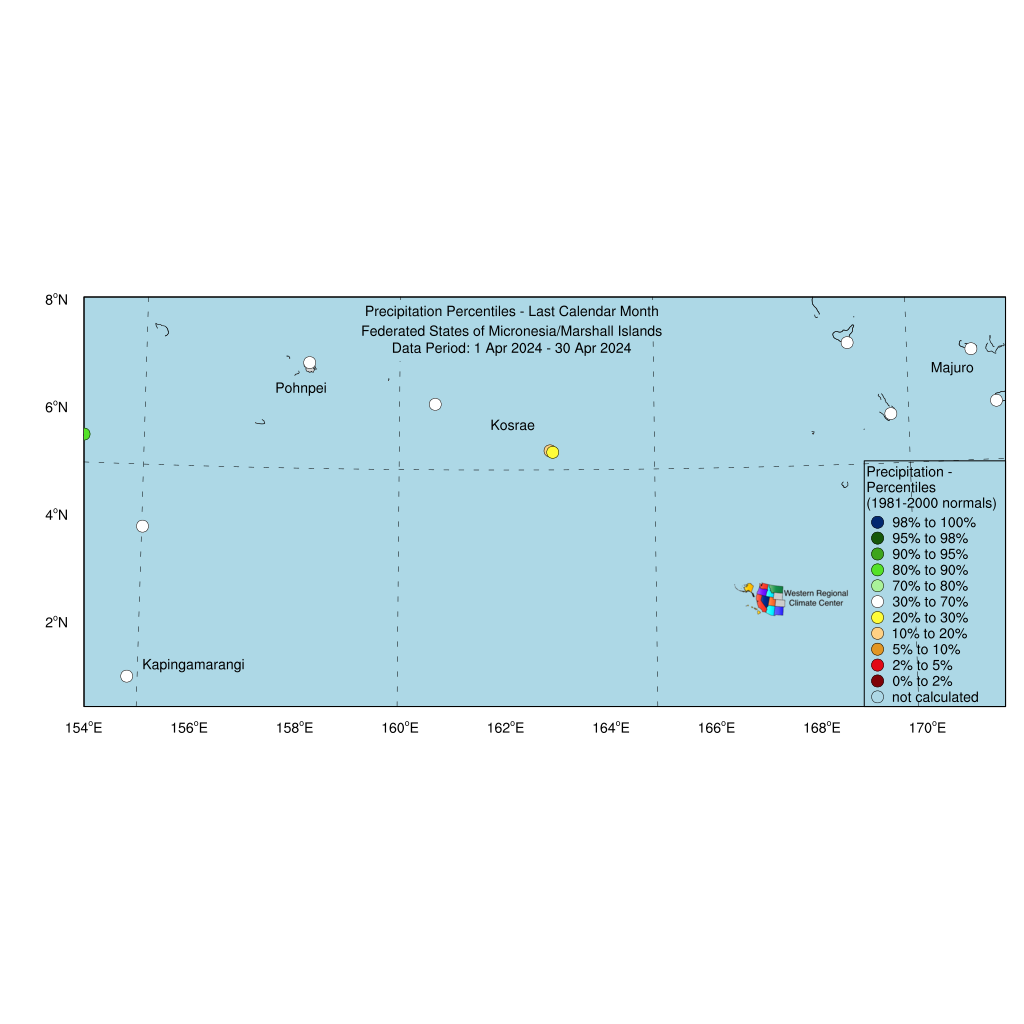
| Micronesia/Marshall Islands Percentile | Grid | last7 | last30 | last60 | lastfull |
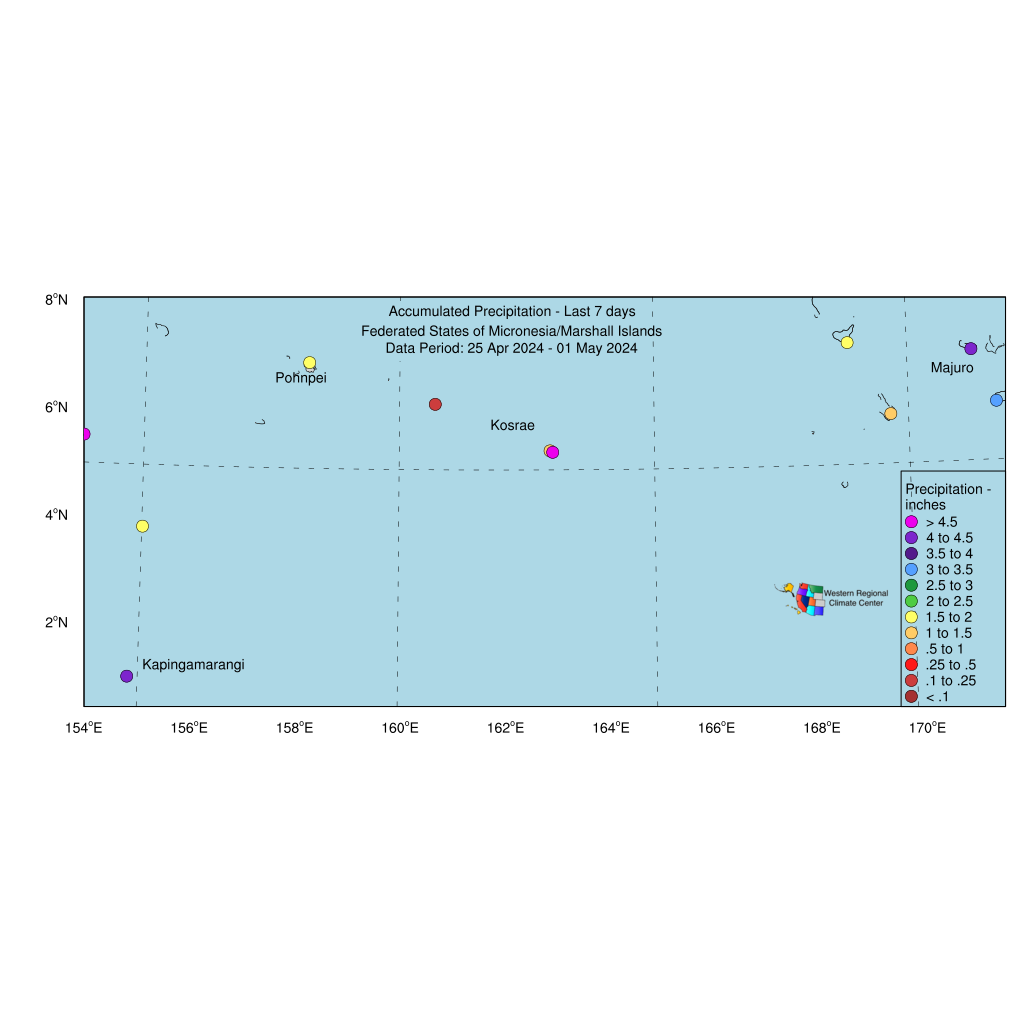
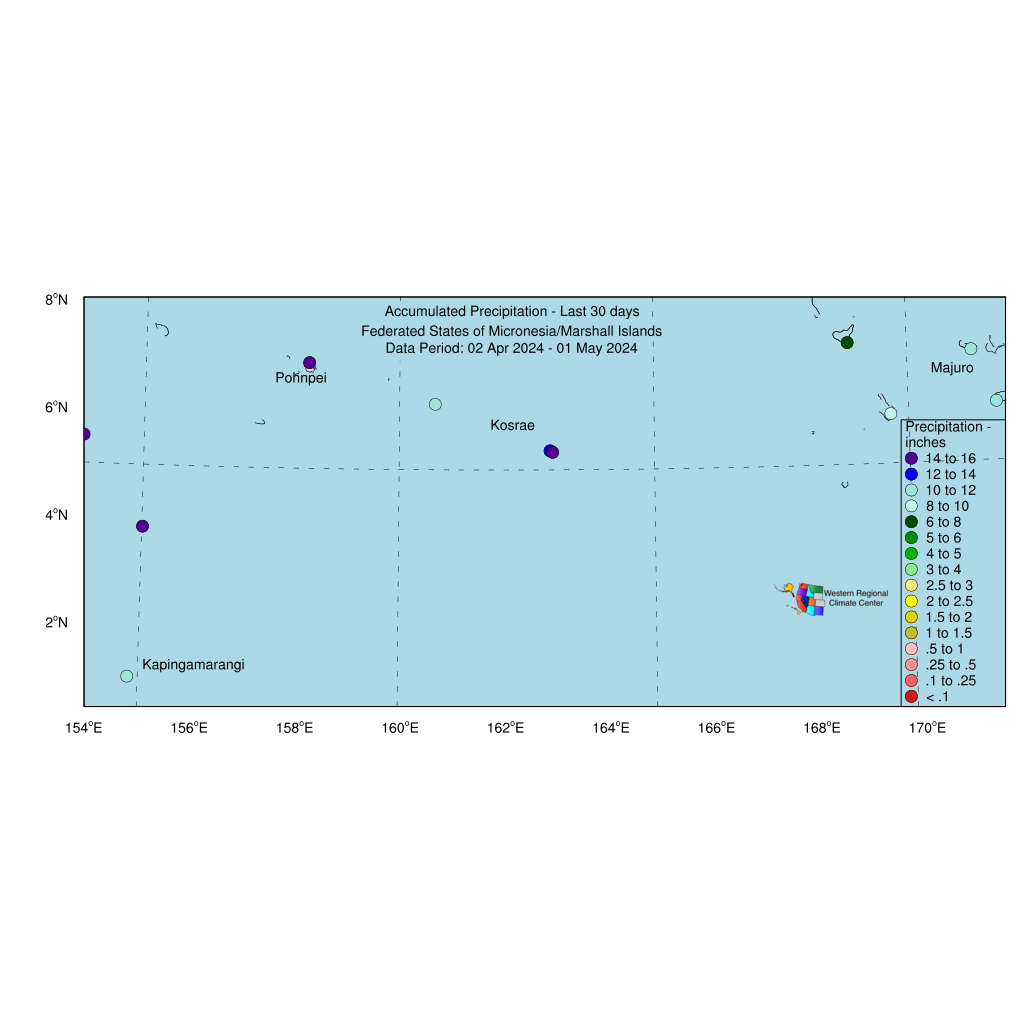
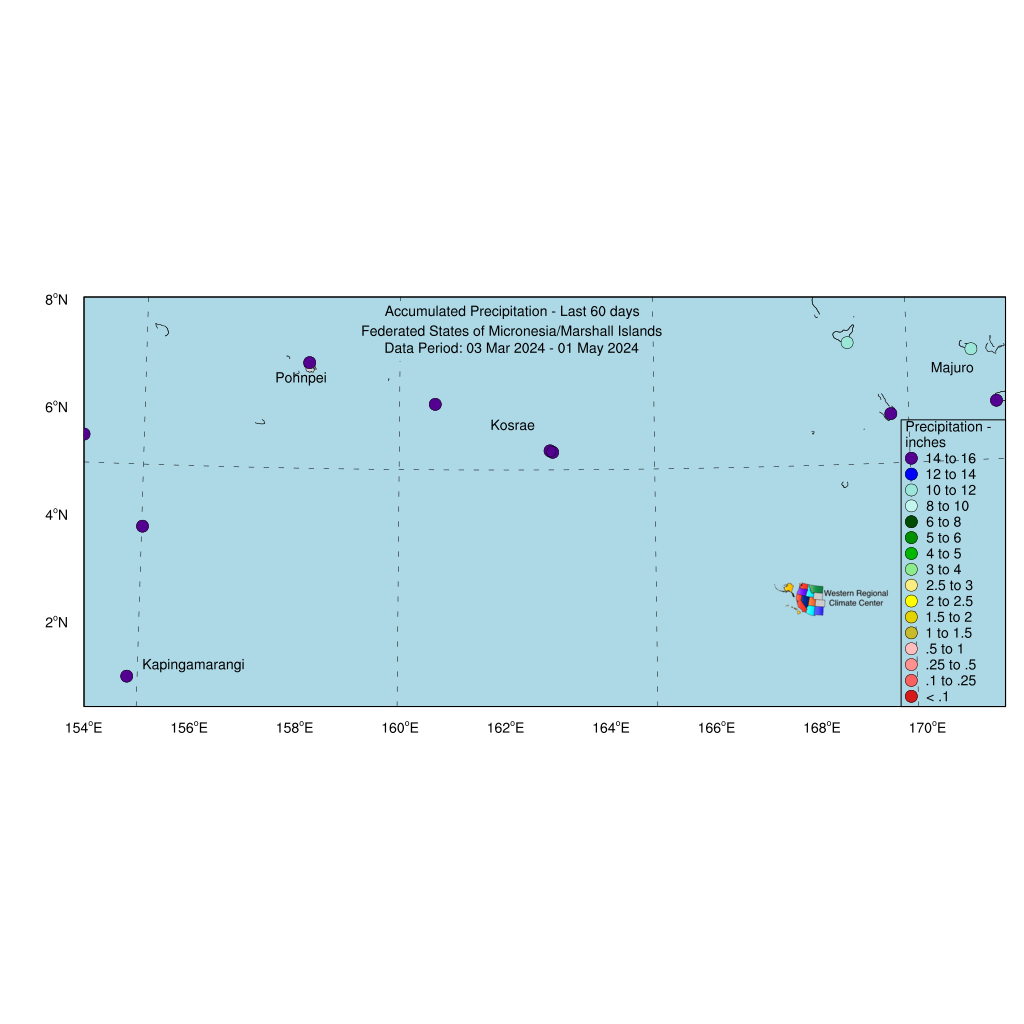
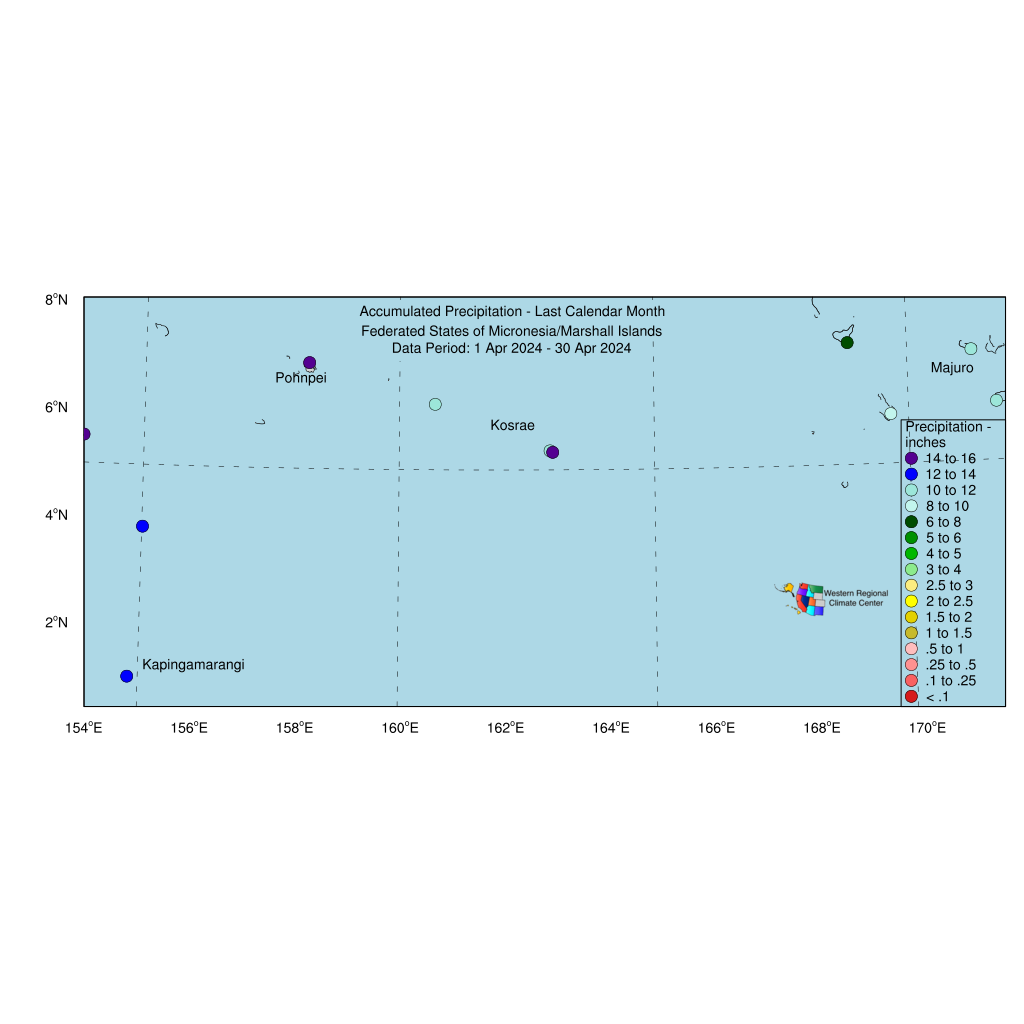
| Micronesia/Marshall Islands Accumulated | Grid | last7 | last30 | last60 | lastfull |
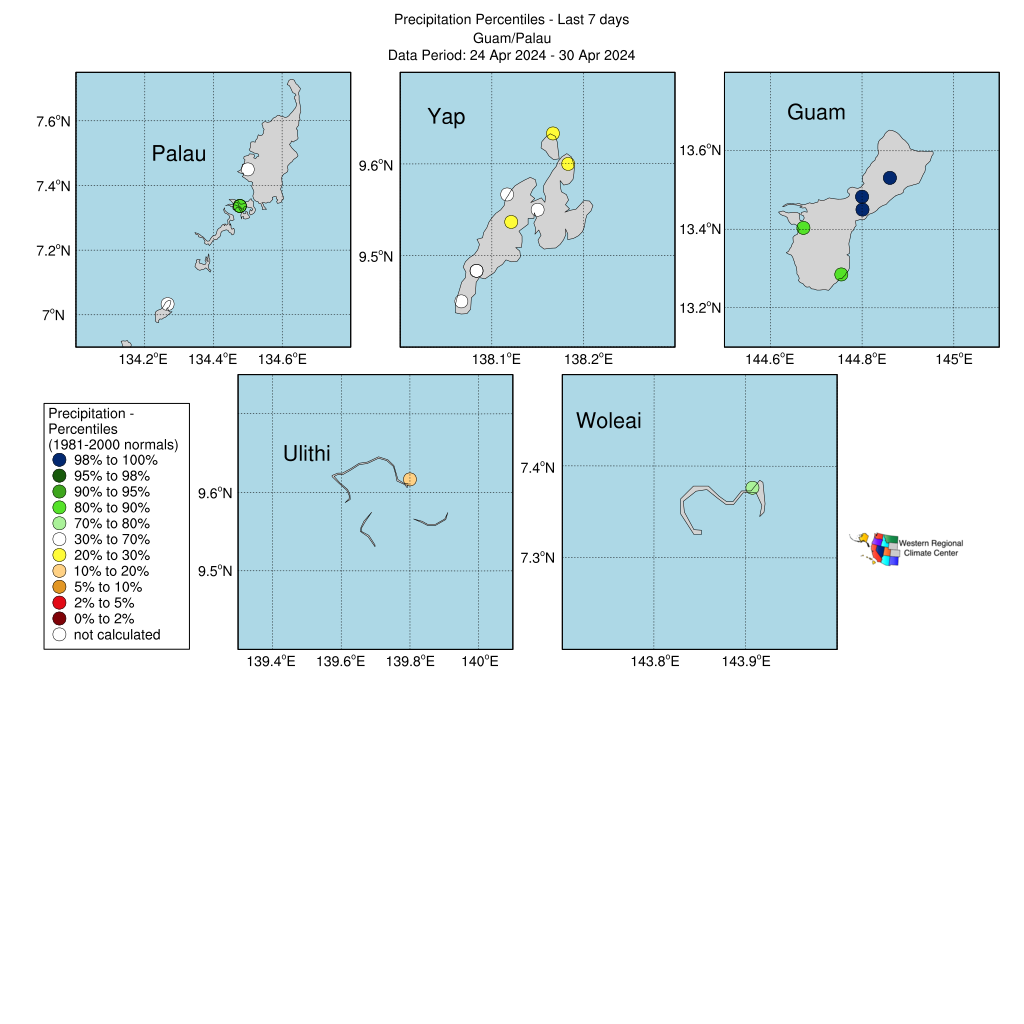
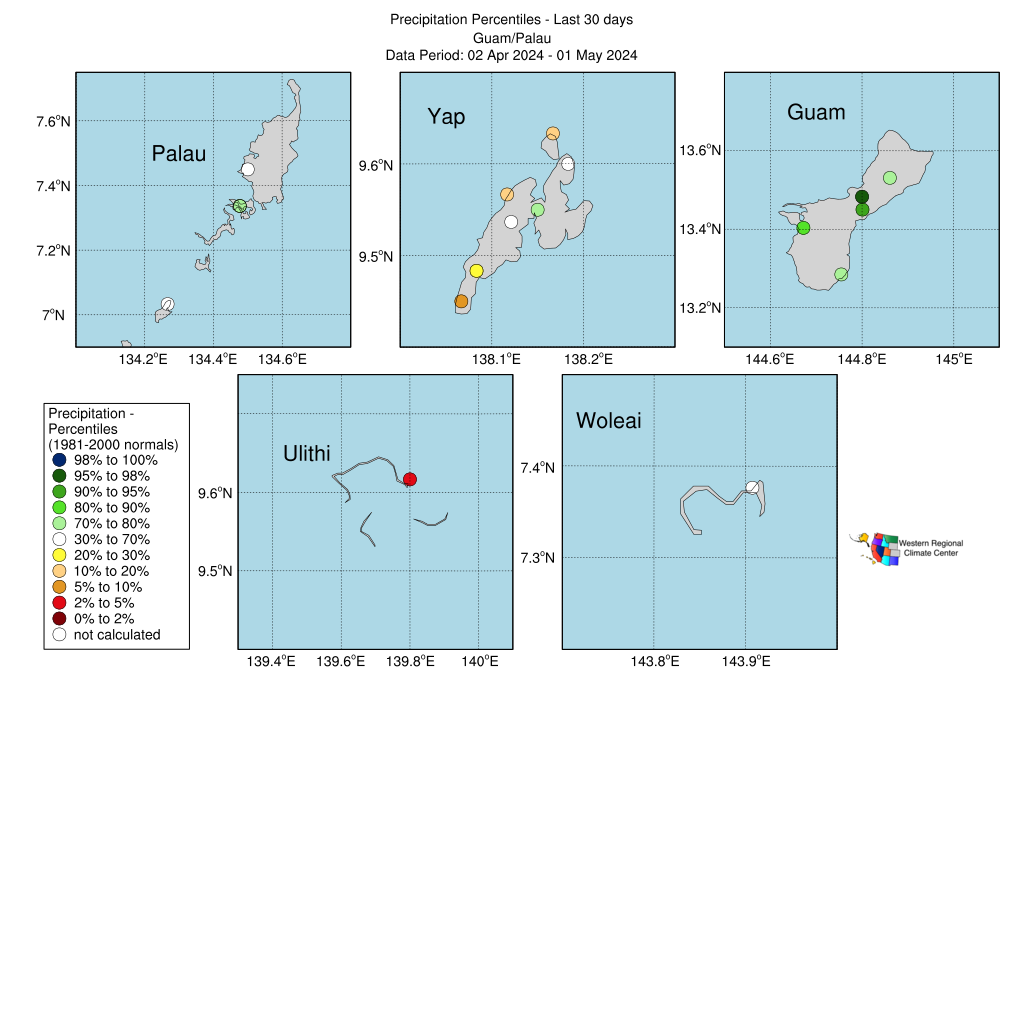
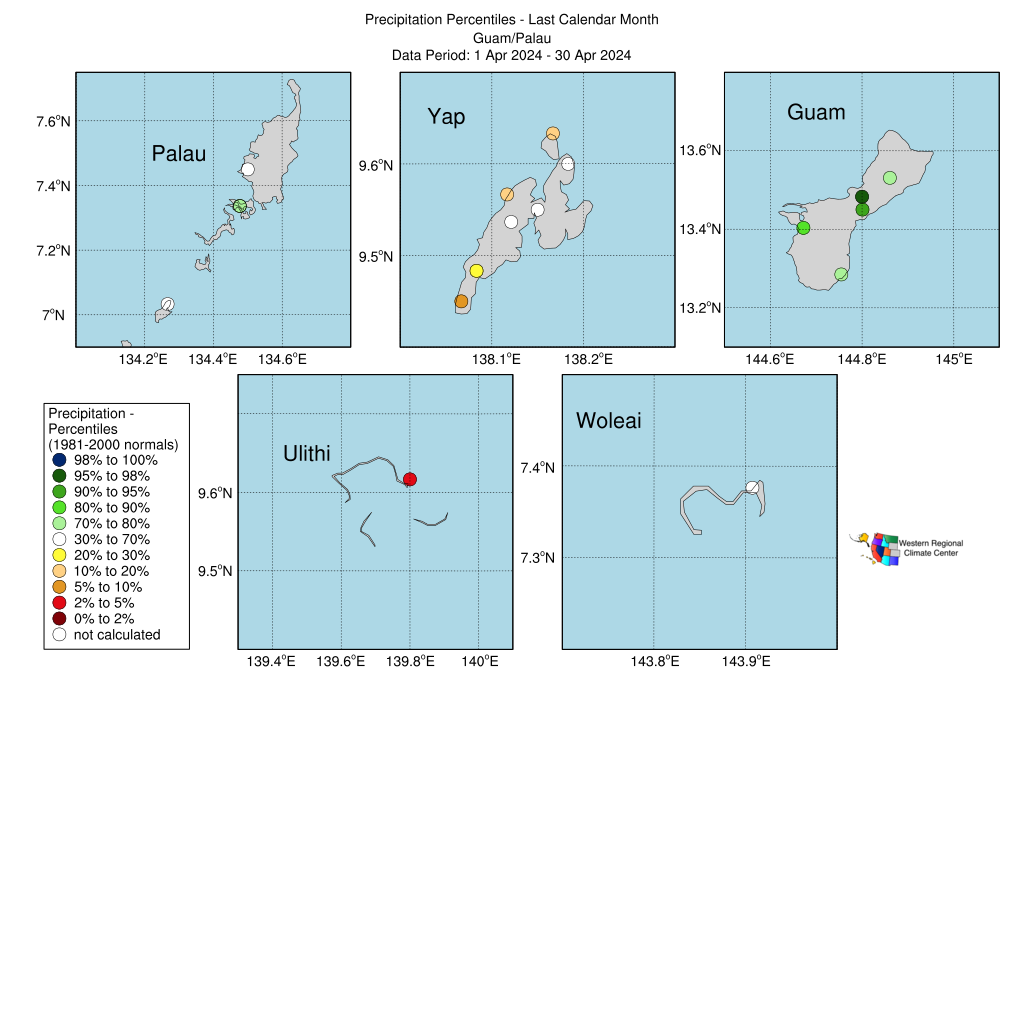
| Guam/Palau Percentile | Grid | last7 | last30 | last60 | lastfull |
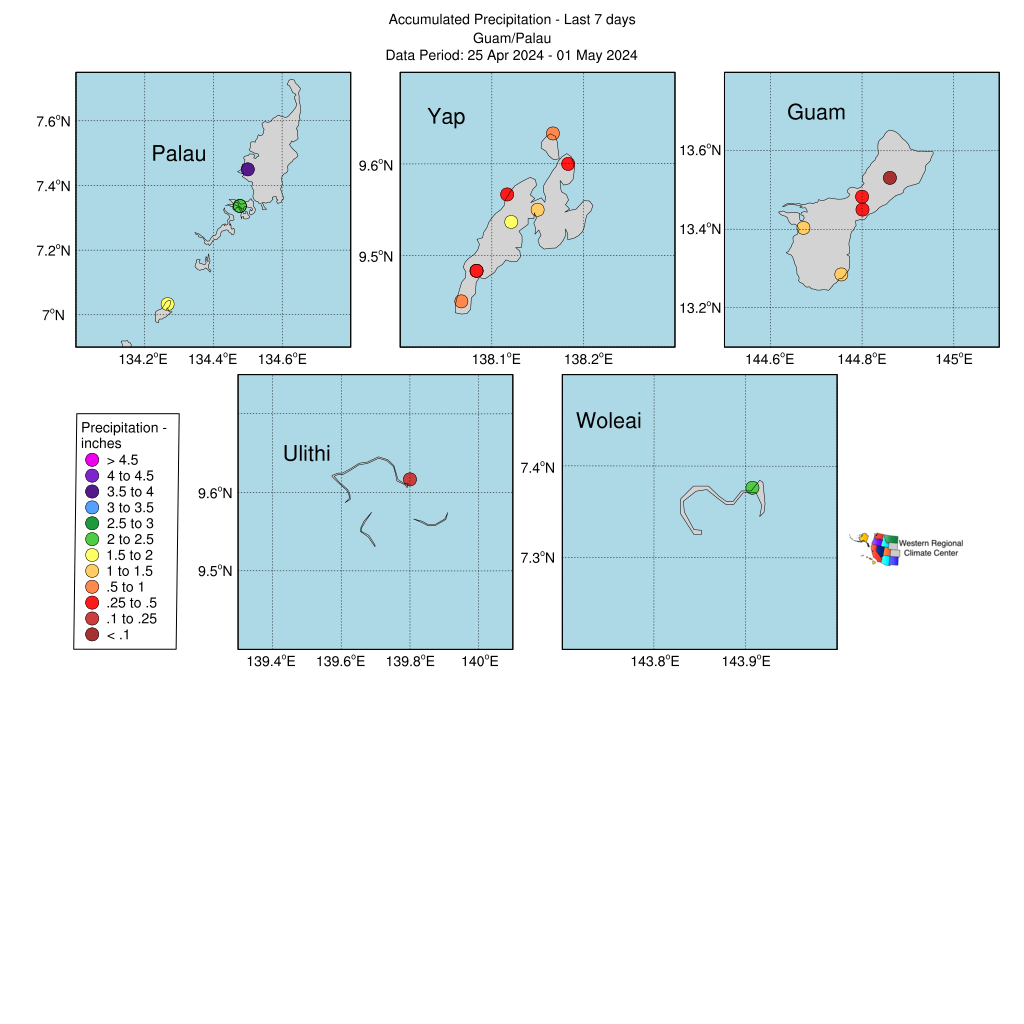
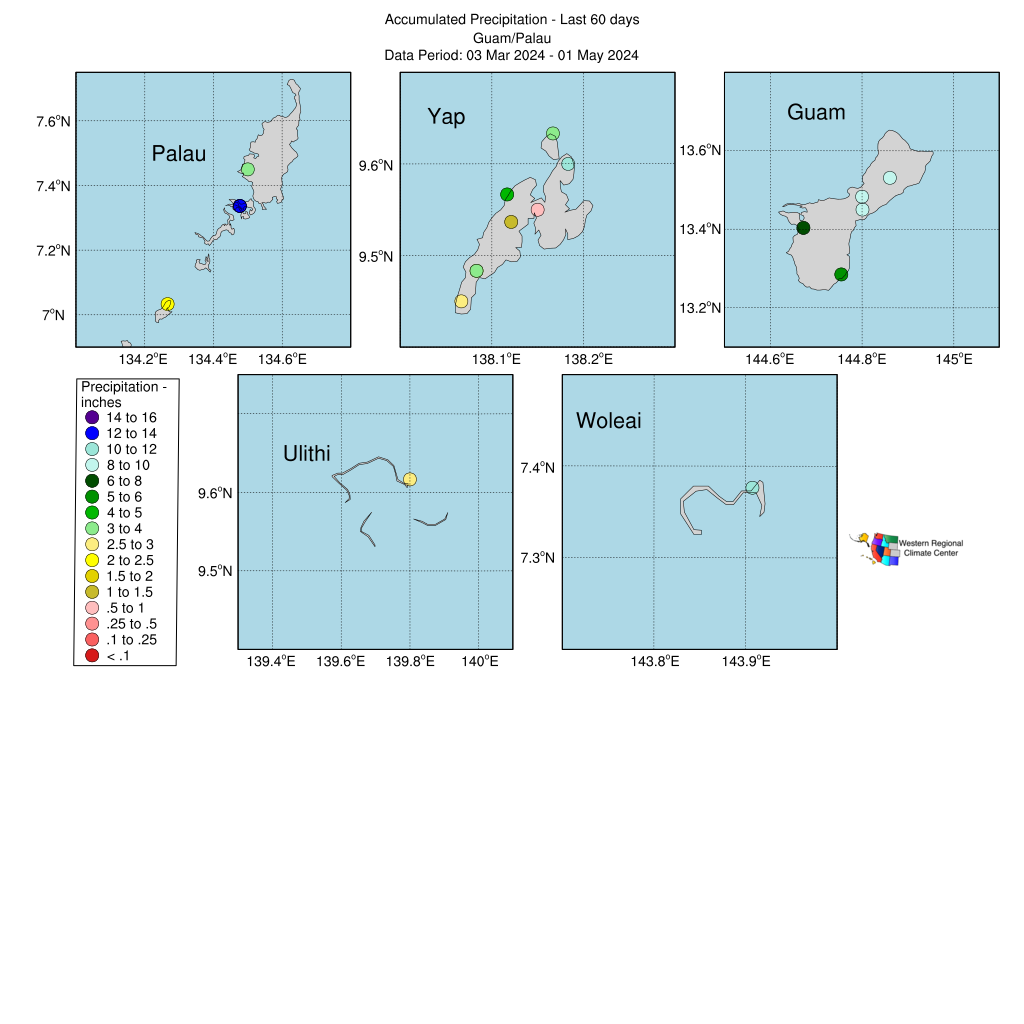
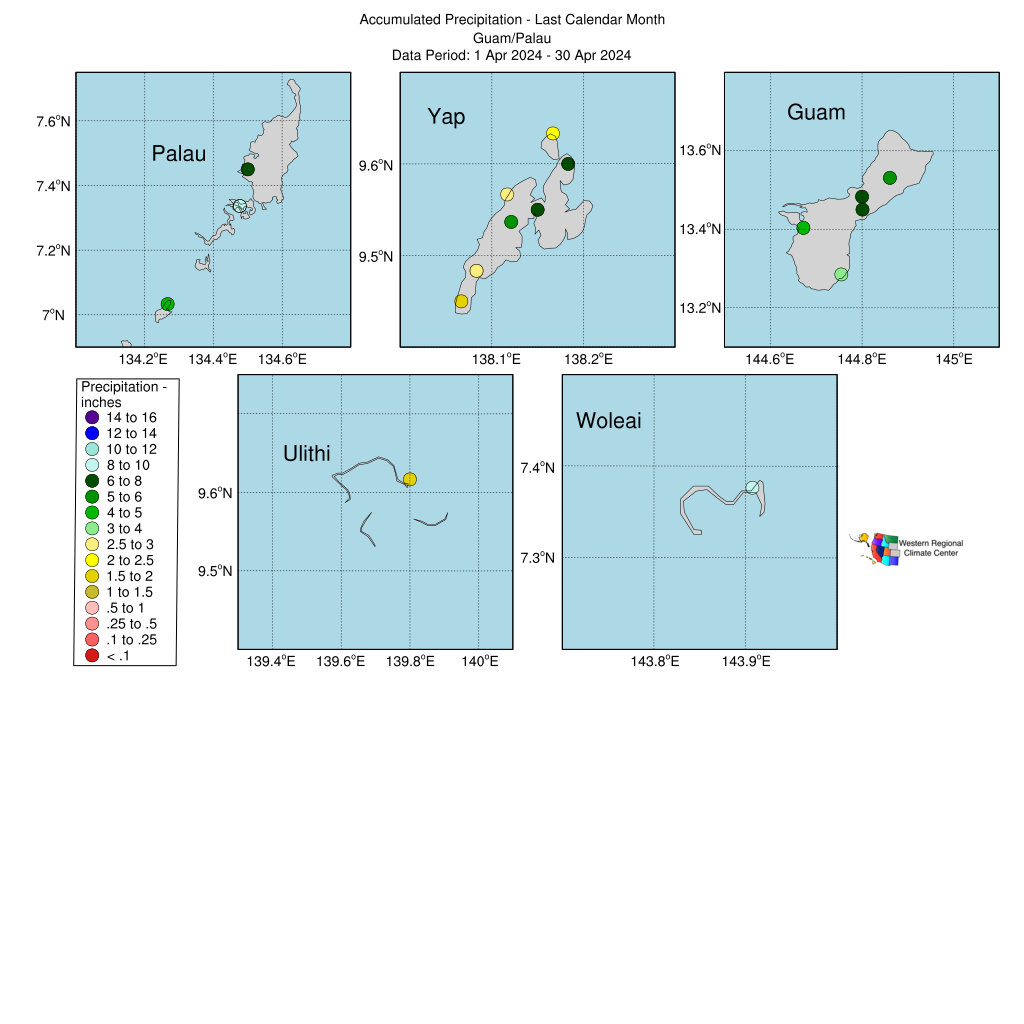
| Guam/Palau Accumulated | Grid | last7 | last30 | last60 | lastfull |
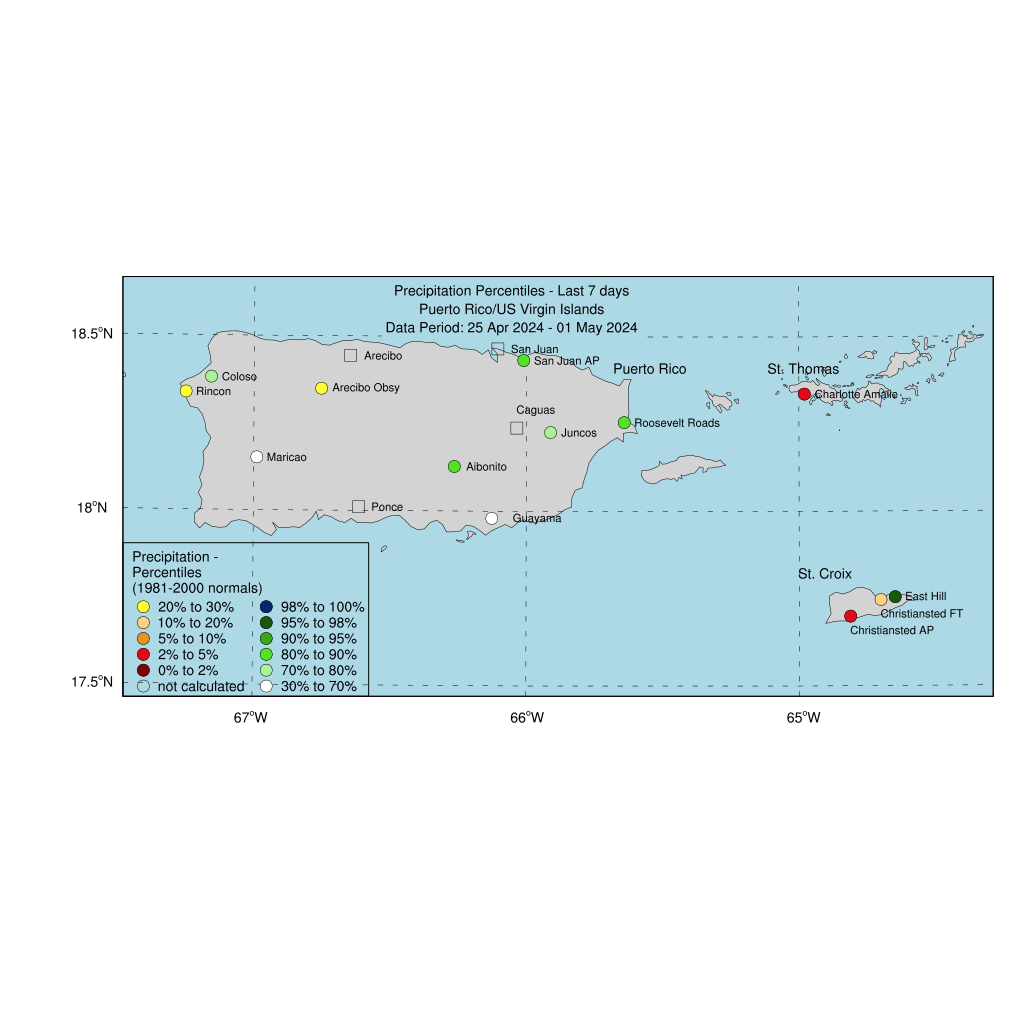
| Puerto Rico/US Virgin Islands Percentile | Grid | last7 | last30 | last60 | lastfull |
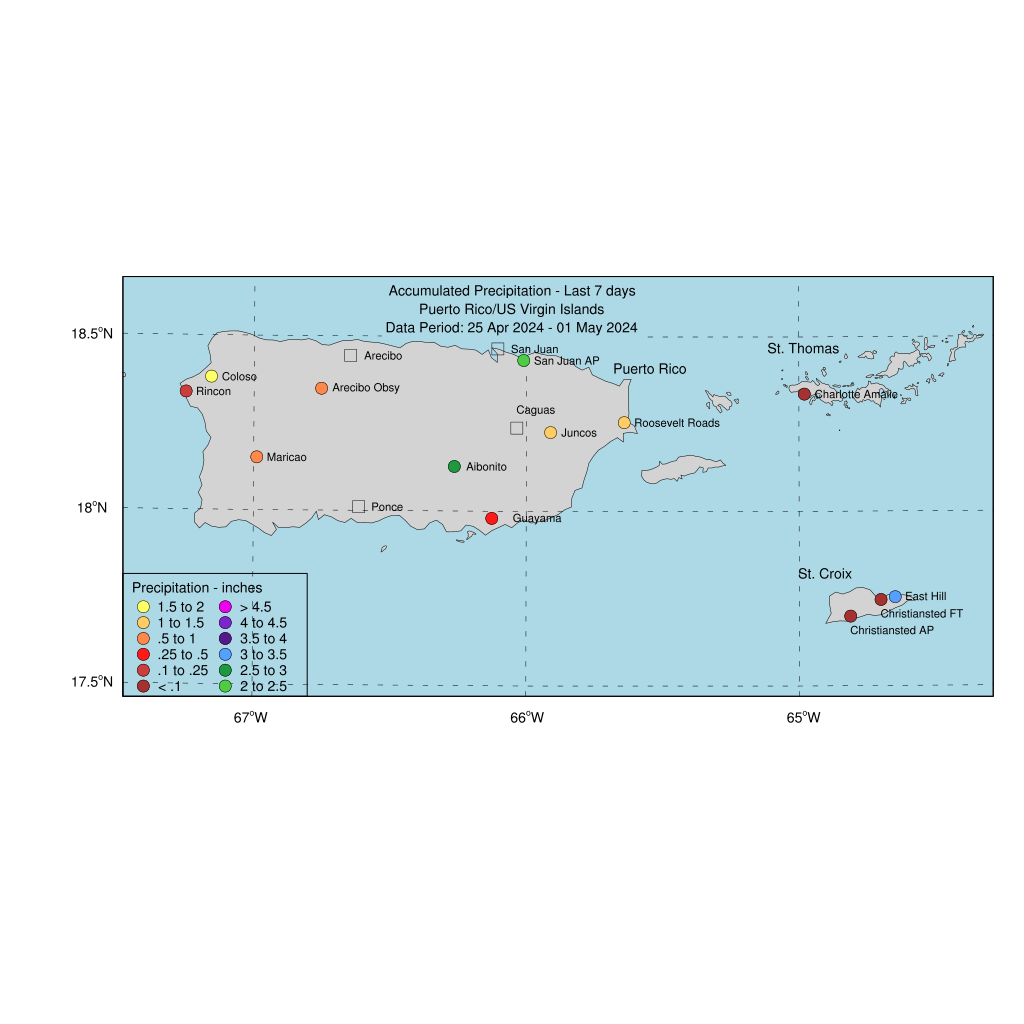
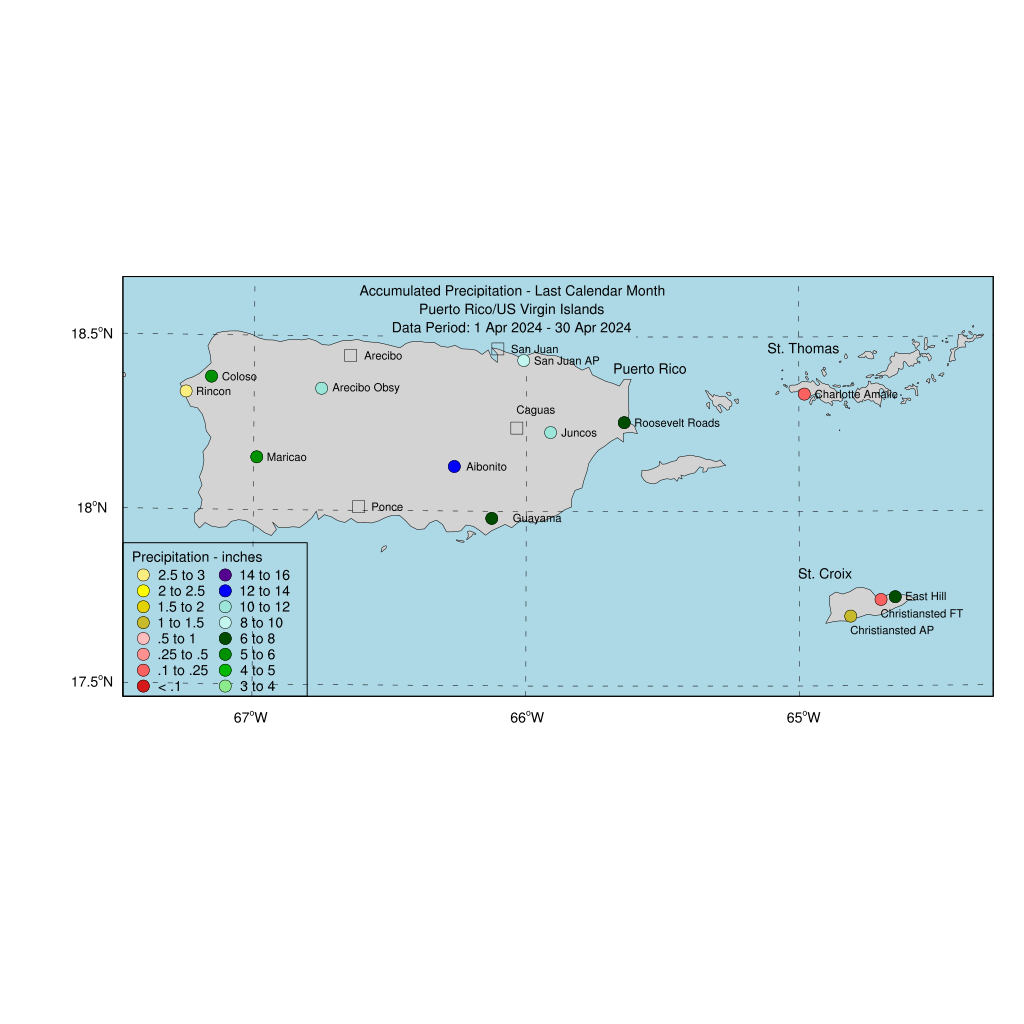
| Puerto Rico/US Virgin Islands Accumulated | Grid | last7 | last30 | last60 | lastfull |
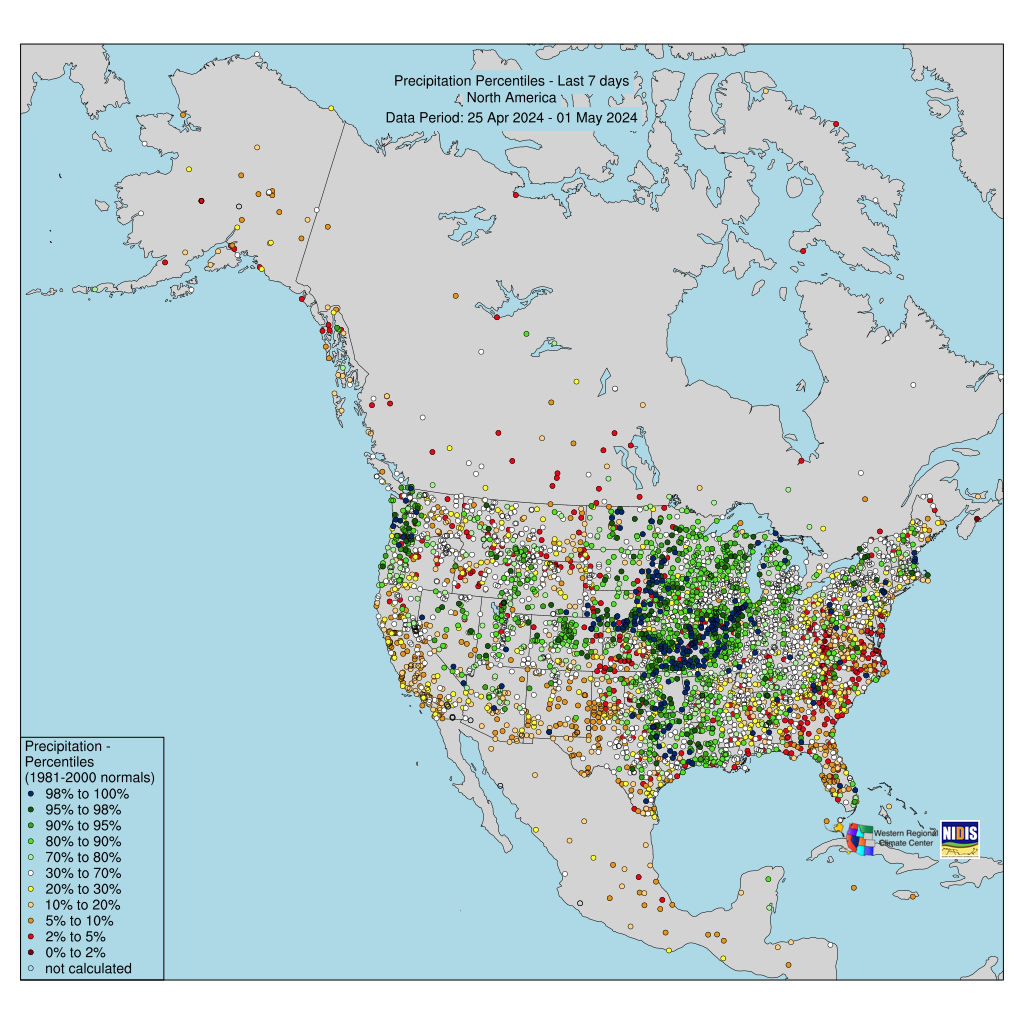
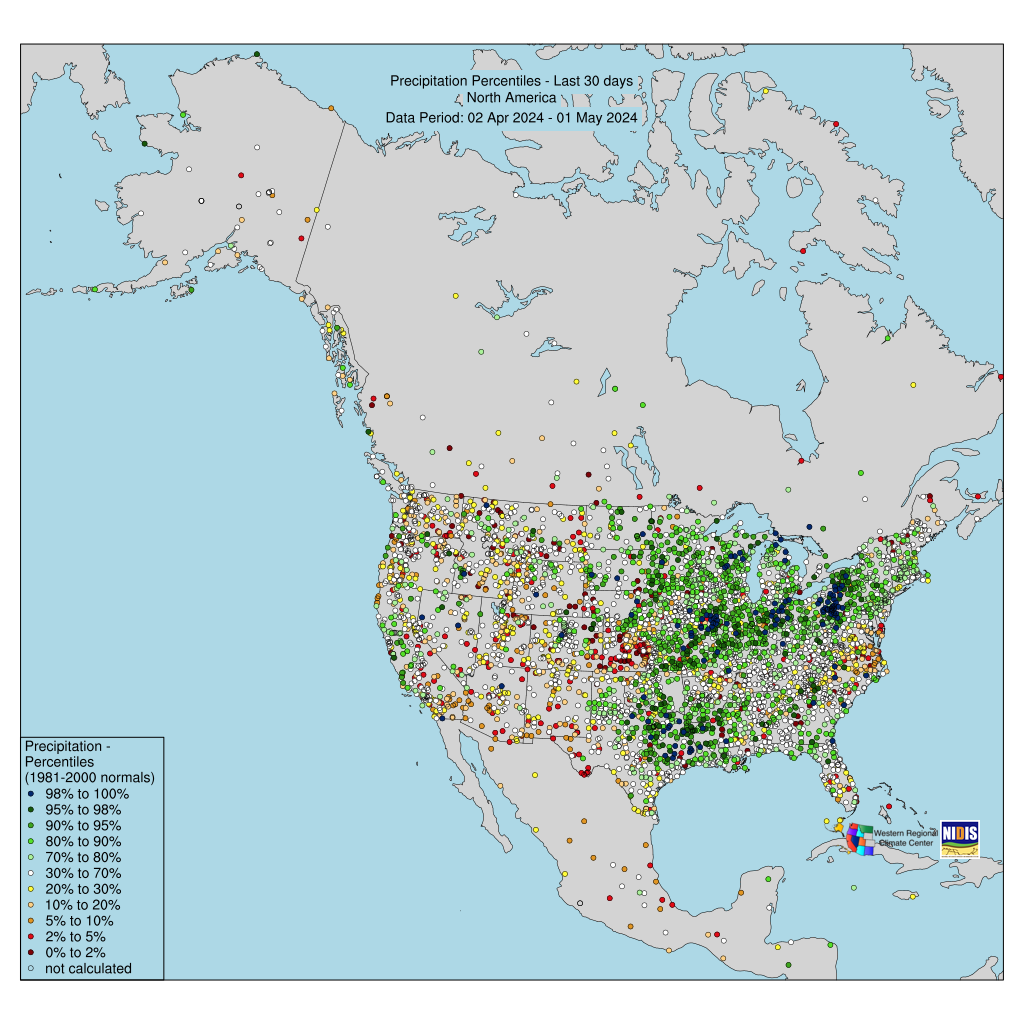
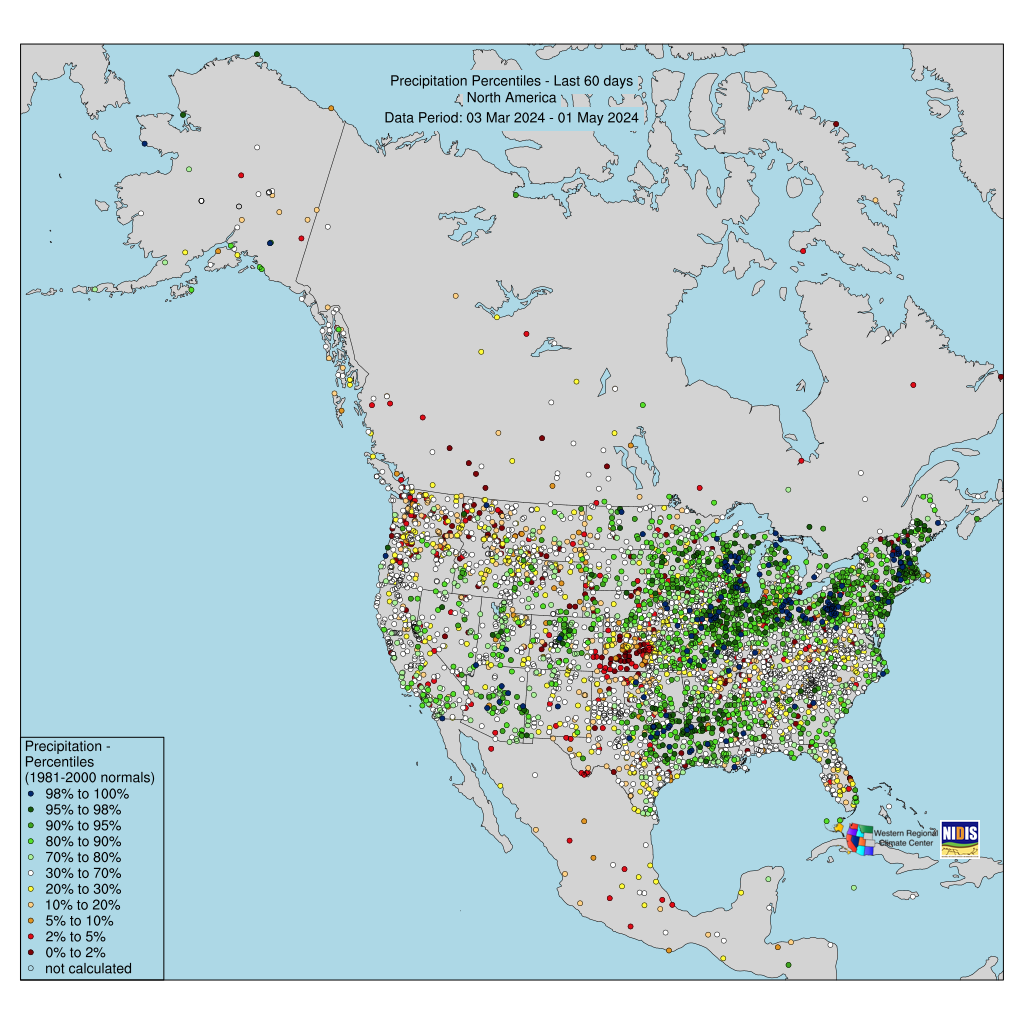
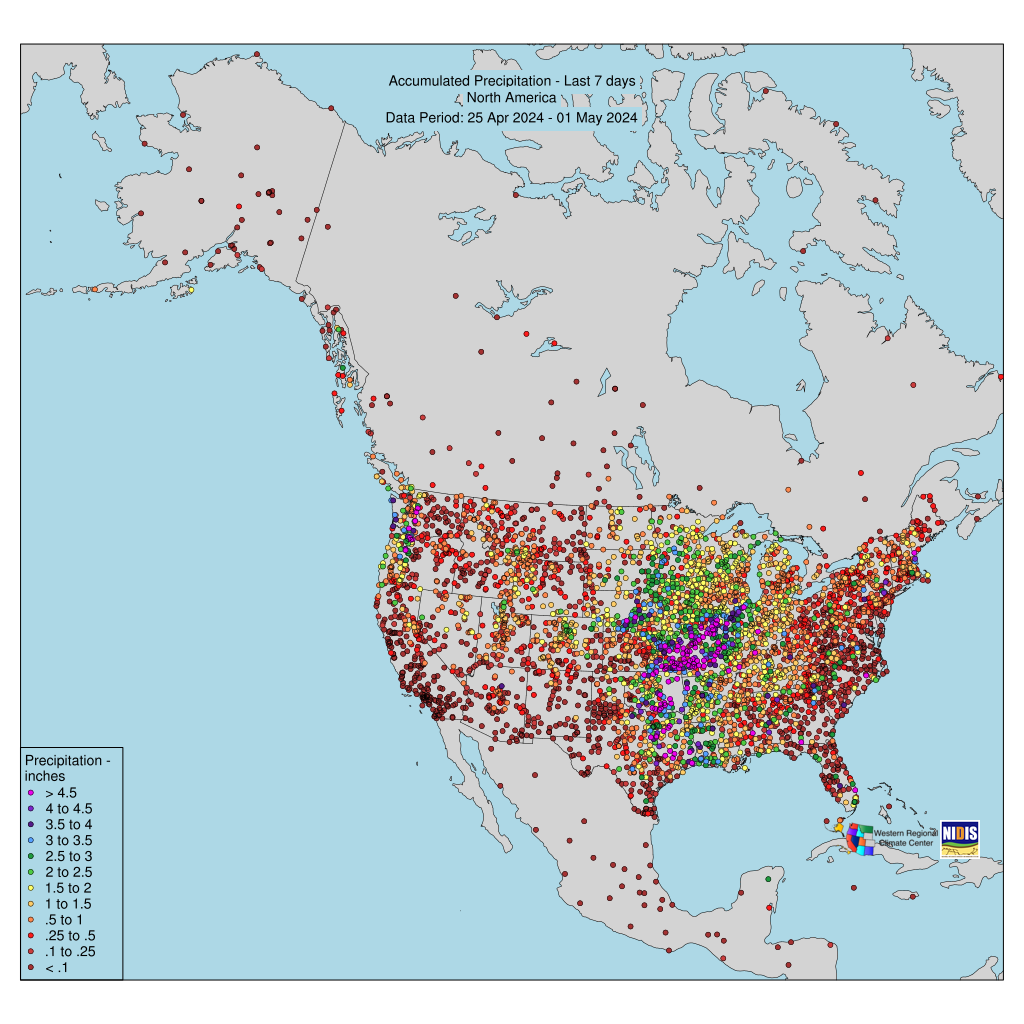
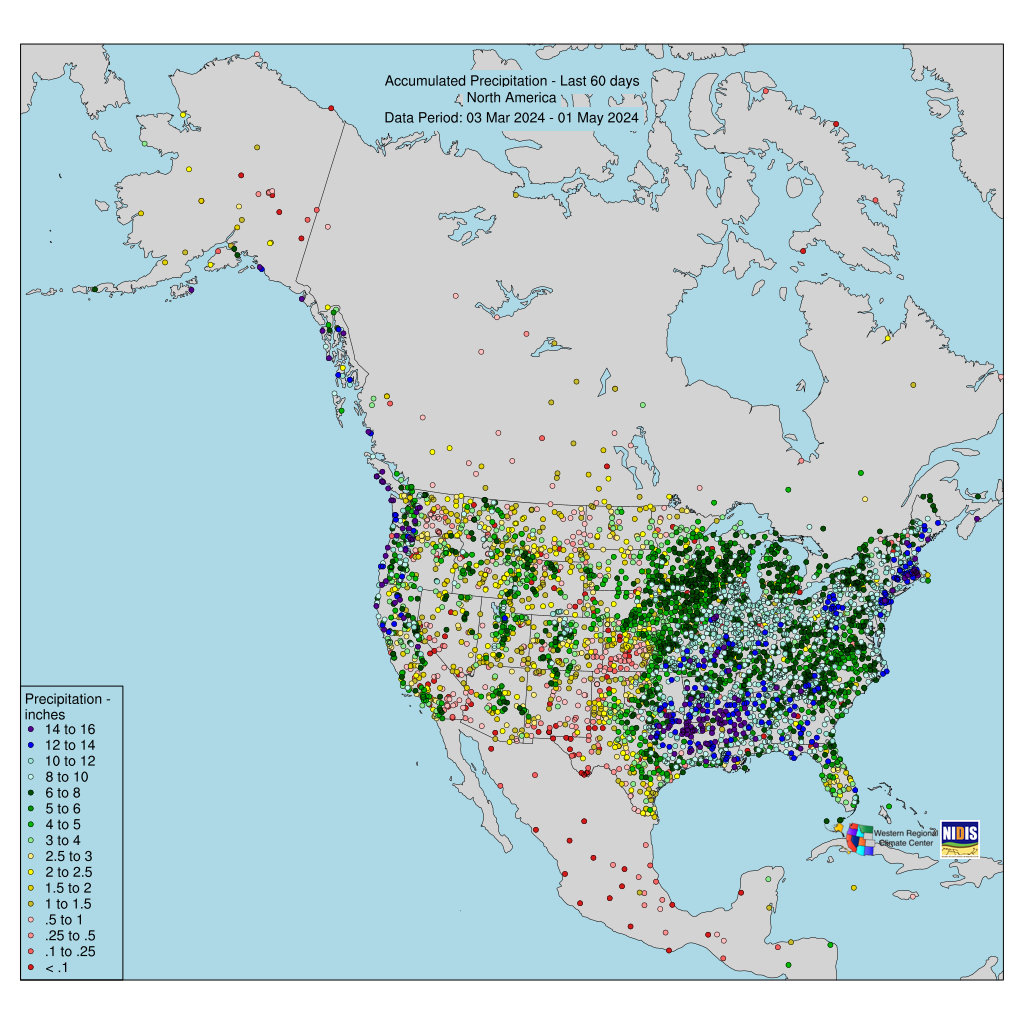
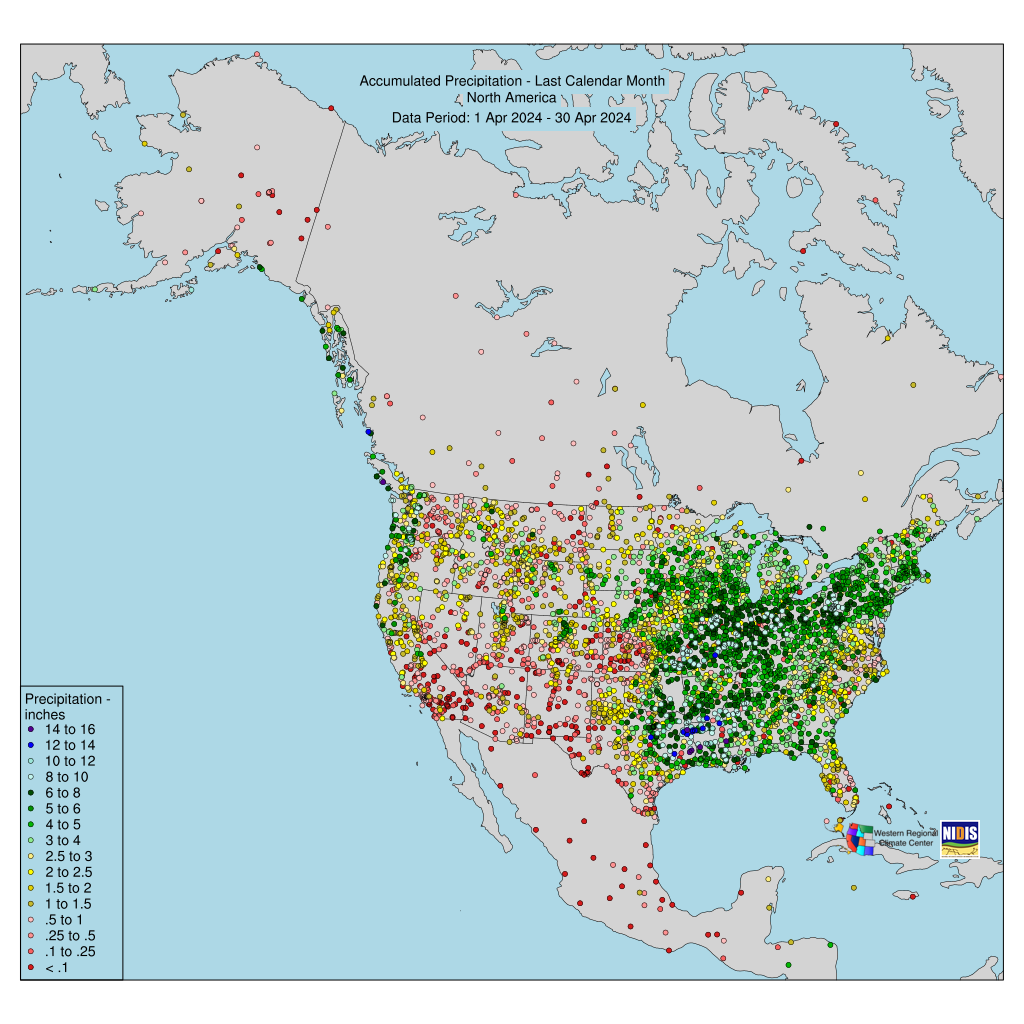
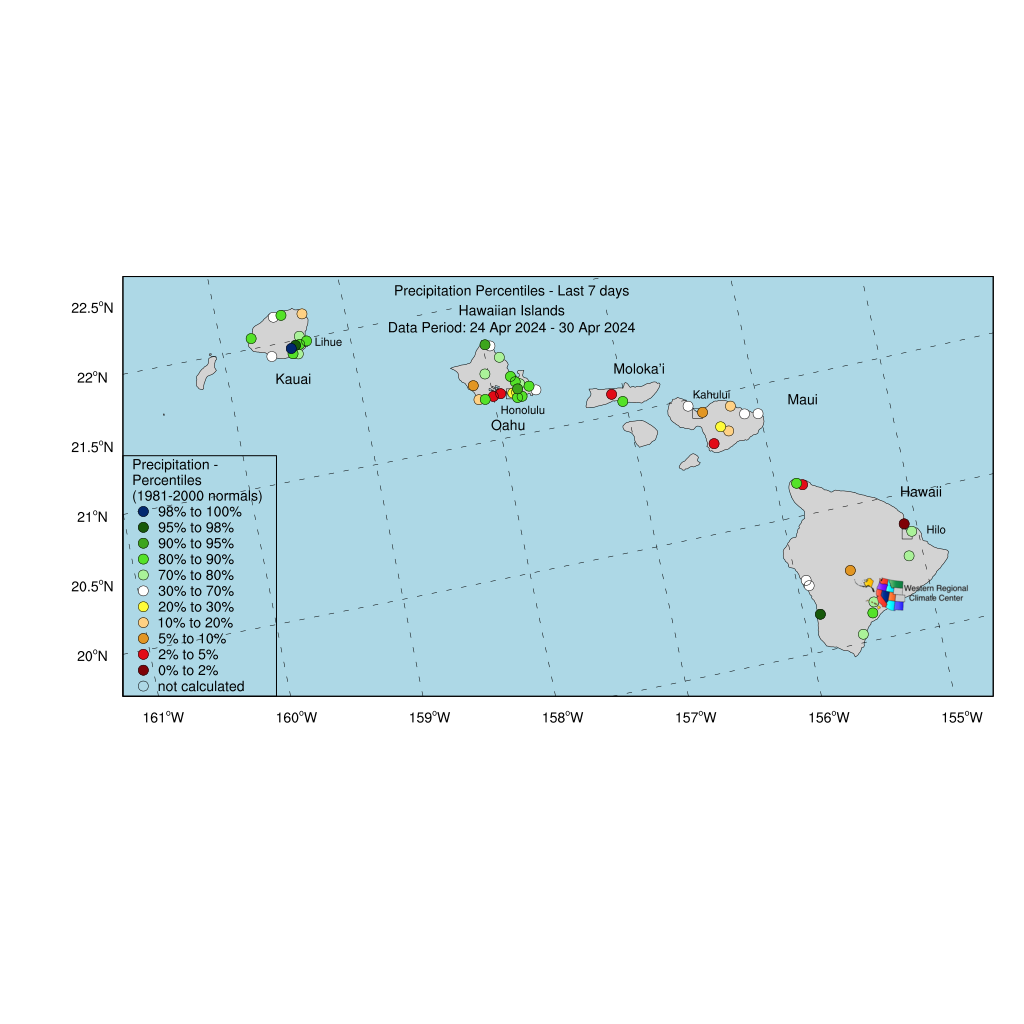
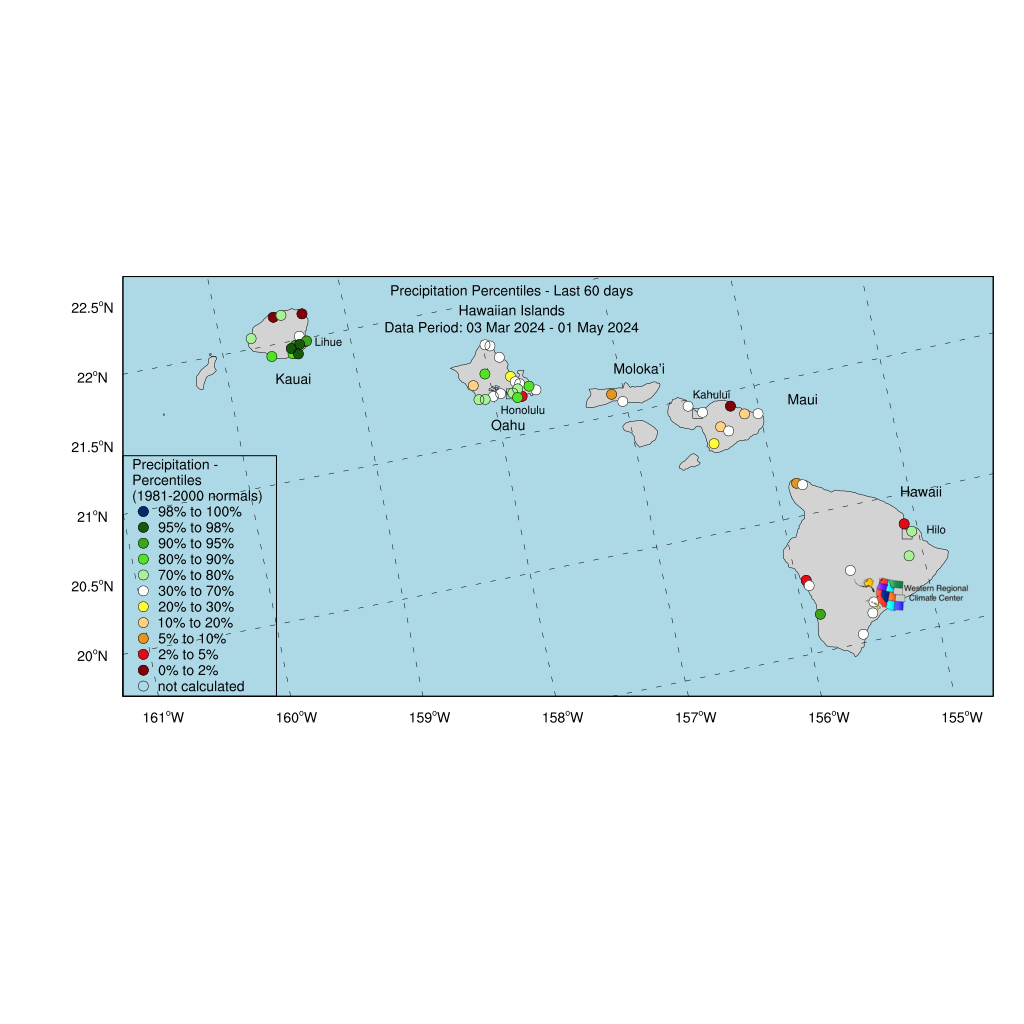
| These maps provide percentile and accumulated precipitation for North America based on daily Global Historical Climate Network (GHCN-D) observations as available in the Regional Climate Centers’ Applied Climate Information System (ACIS). The product is updated at 0900 Pacific Time daily. Available maps are for the last 7-, 30- and 60-days, plus the last full month. Not all stations may appear uniformly each day or on each map either because of the 0900 runtime cutoff or they may have a 1-3 day lag in their reporting time. In naturally occurring dry regions such as southern California in the summer, it may not be possible to compute a percentile for a short period such as 7-days; when this happens it is indicated as an open circle. |